
In this module we will be download satellite generated Digital Elevation Model (DEM) data, extract elevation data for Himalayan features, plan seasonal traverses, generate contours and hill shades and create an elevation profile for a Himalayan traverse.
Contents
- Digital Elevation Model
- Downloading Elevation Data
- Visualization
- Exctacting elevation
- Seasonal traverses
- Generating Contours
- Generating Hill Shades
- Elevation Profile
Digital Elevation Model
A Digital Elevation Model (DEM) is a representation of the bare ground (bare earth) topographic surface of the Earth excluding trees, buildings, and any other surface objects.
Shuttle Radar Topography Mission
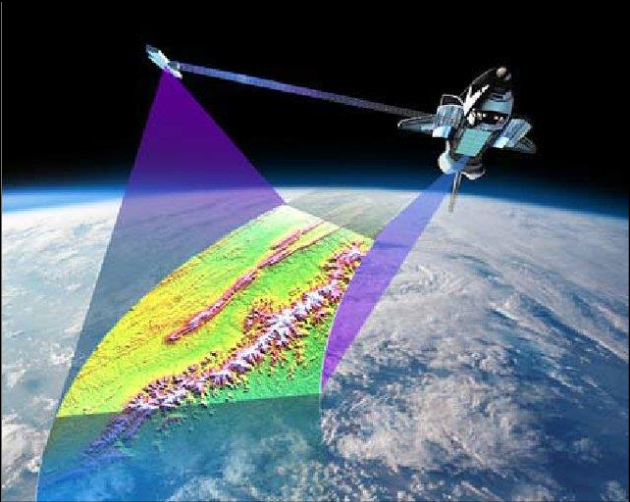
The Shuttle Radar Topography Mission (SRTM) obtained elevation data on a near-global scale to generate the most complete high-resolution digital topographic database of Earth. SRTM consisted of a specially modified radar system that flew onboard the Space Shuttle Endeavour during an 11-day mission in February of 2000
Downloading Elevation Data

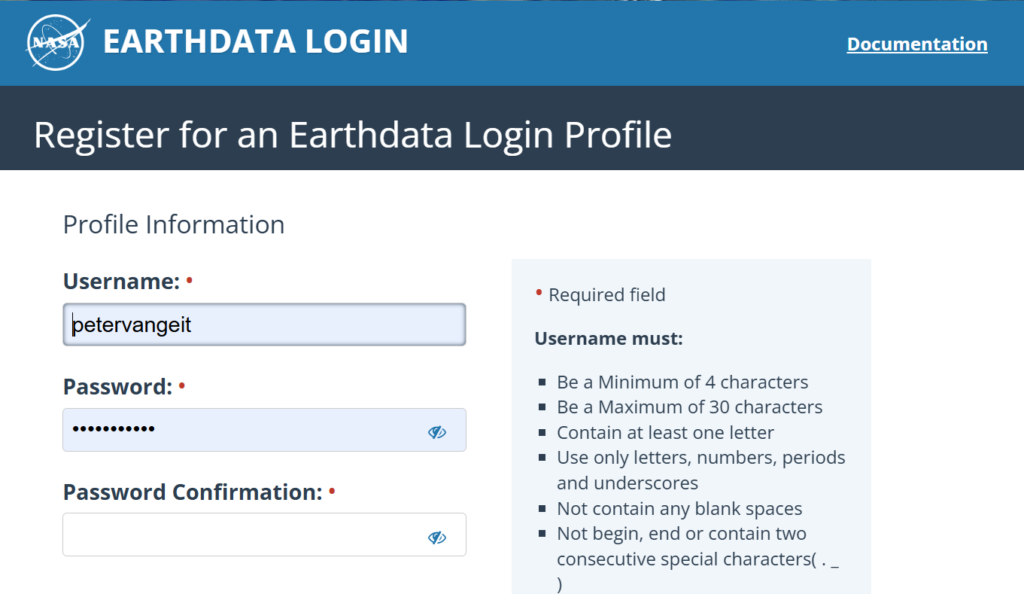
We will download DEM data from the NASA Earthdata website. To do so we have to create a profile.
https://urs.earthdata.nasa.gov//users/new
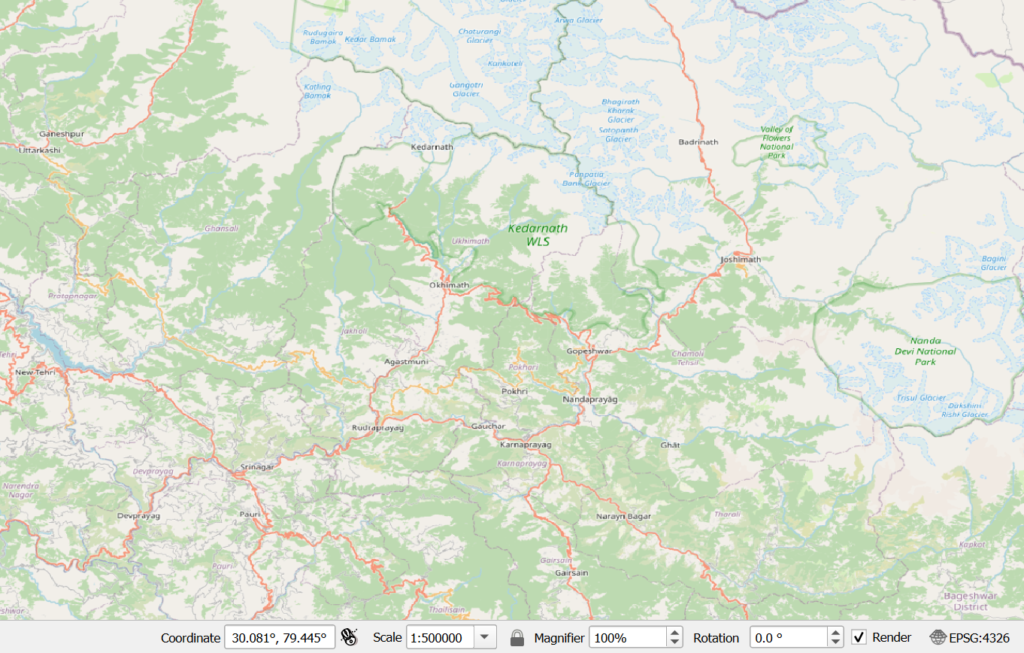
Set your map window centered around Kedarnath at scale 1:500K
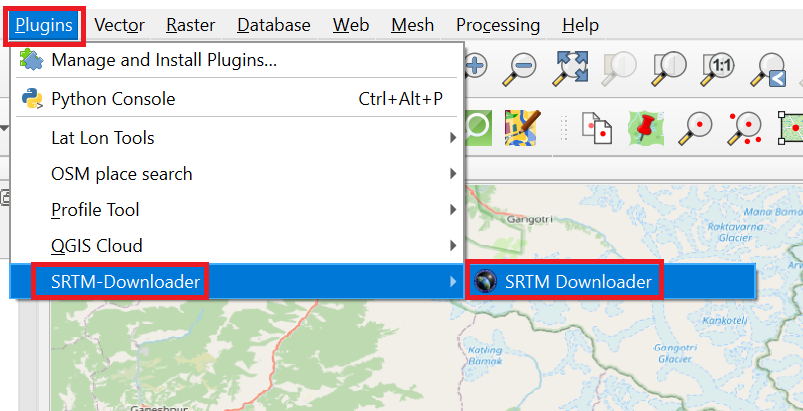
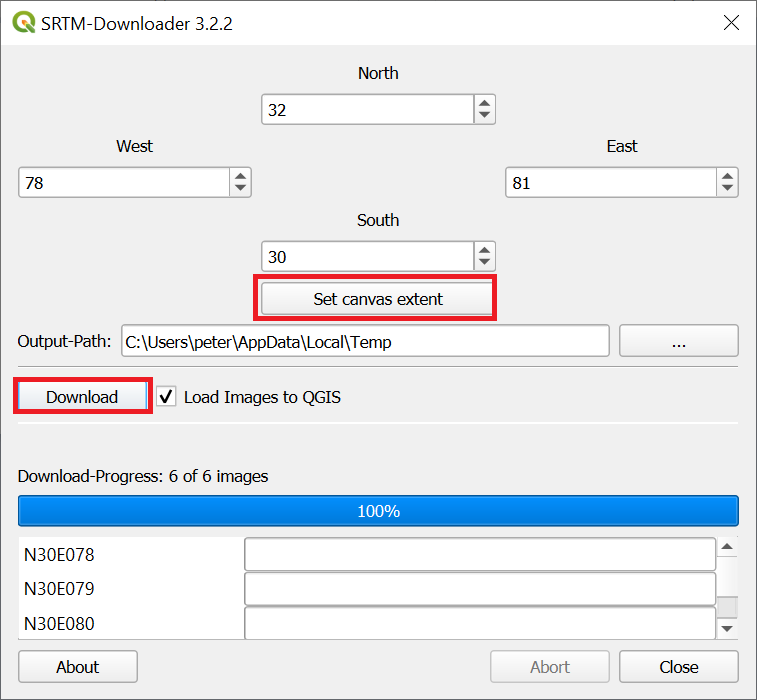
We can download DEM data for the above region directly in QGIS using the SRTM Downloader plugin
Visualization
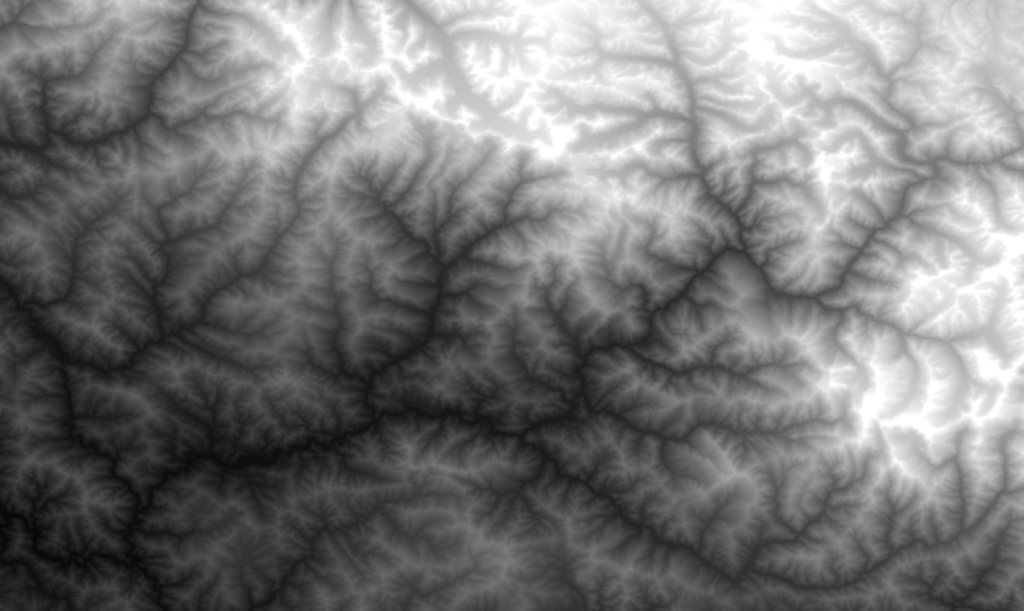
Six 1×1 arc-degree DEM tiles are downloaded and merged into one raster layer spanning 30-31 degrees North and 78-80 degrees East and shown as below. The raster layer consists of 16 bit integers representing the elevation at each point from black (lowest) to white (highest)
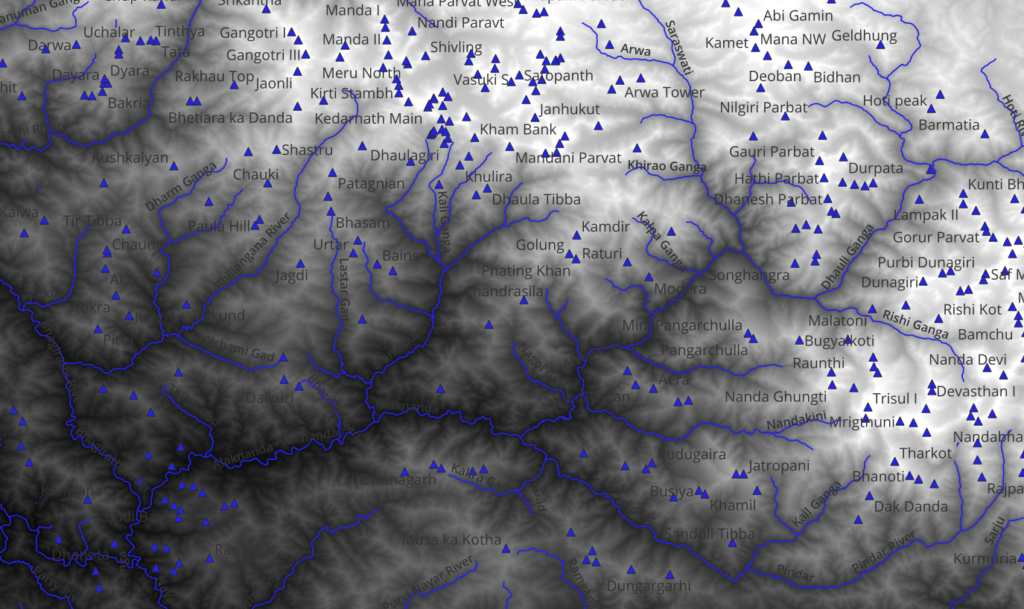
Overlay rivers and peaks to see correlation with the downloaded elevation data
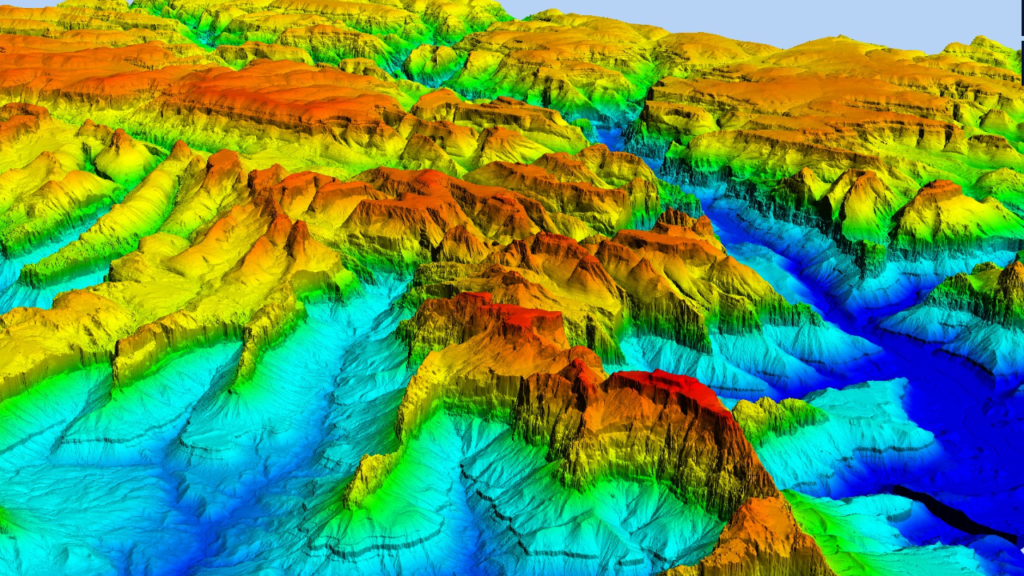
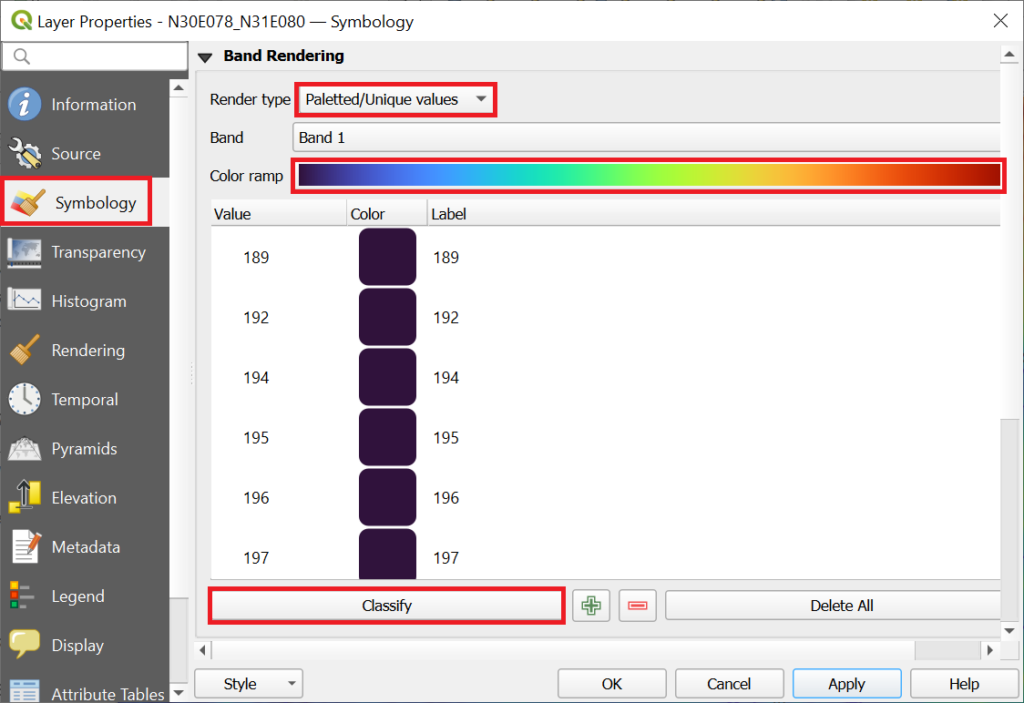
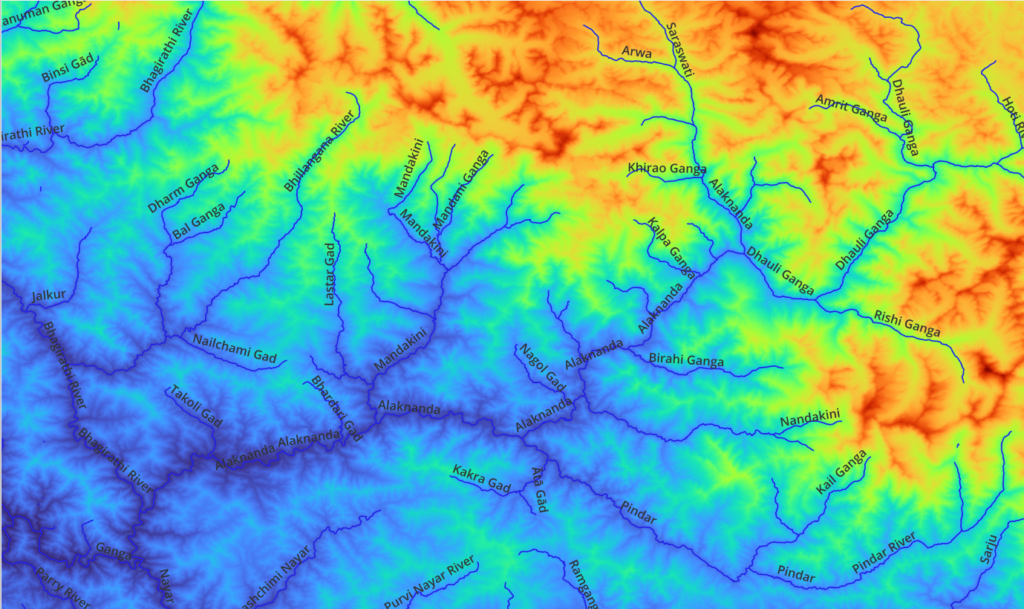
We can also visualize the raster layers using a more comprehensive color spectrum
Extracting Elevation
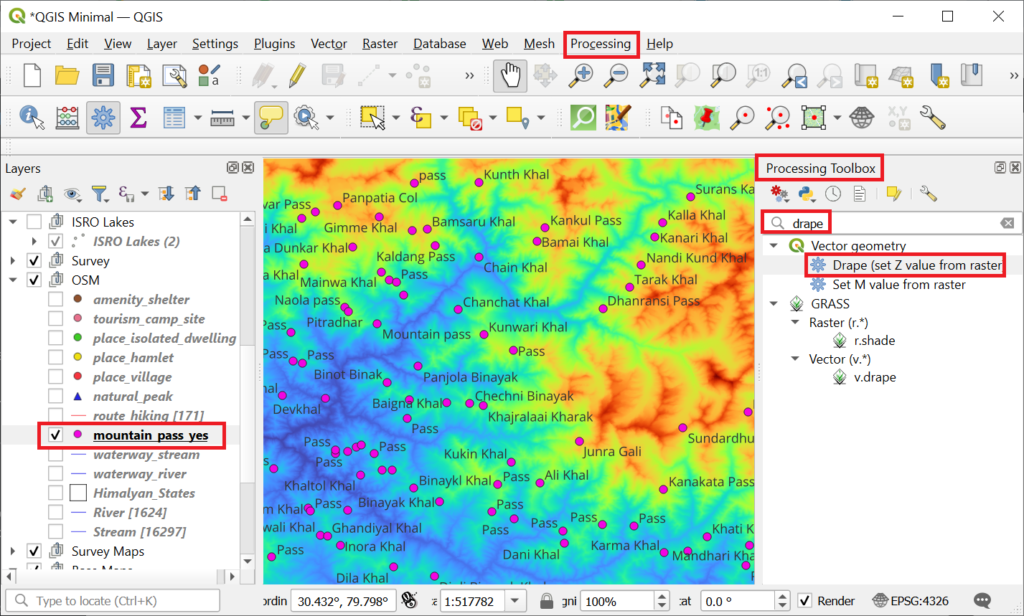
We can extract elevation for various terrain features from the DEM raster layer. Let’s identify the height of each OSM mountain pass downloaded in part 2. Select the “Drape” function from the “Processing Toolbox”
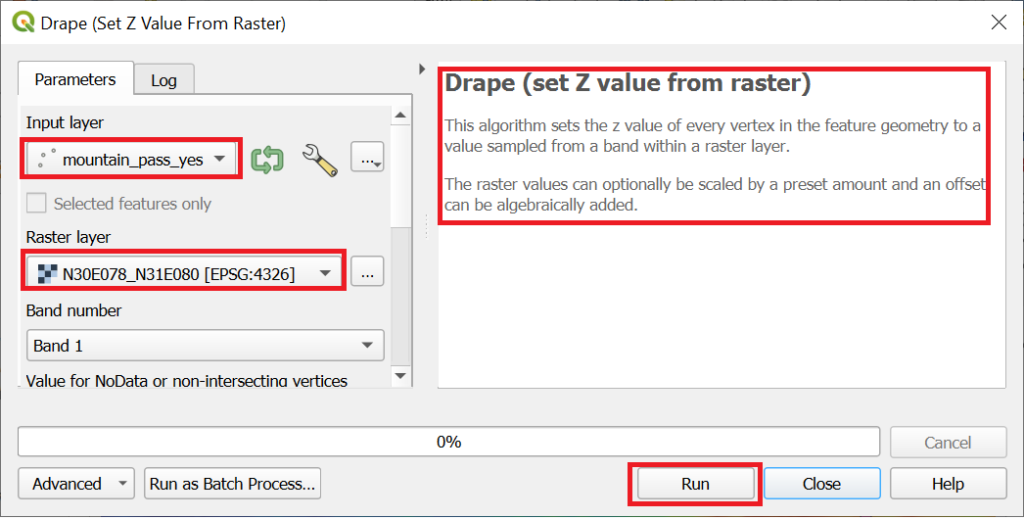
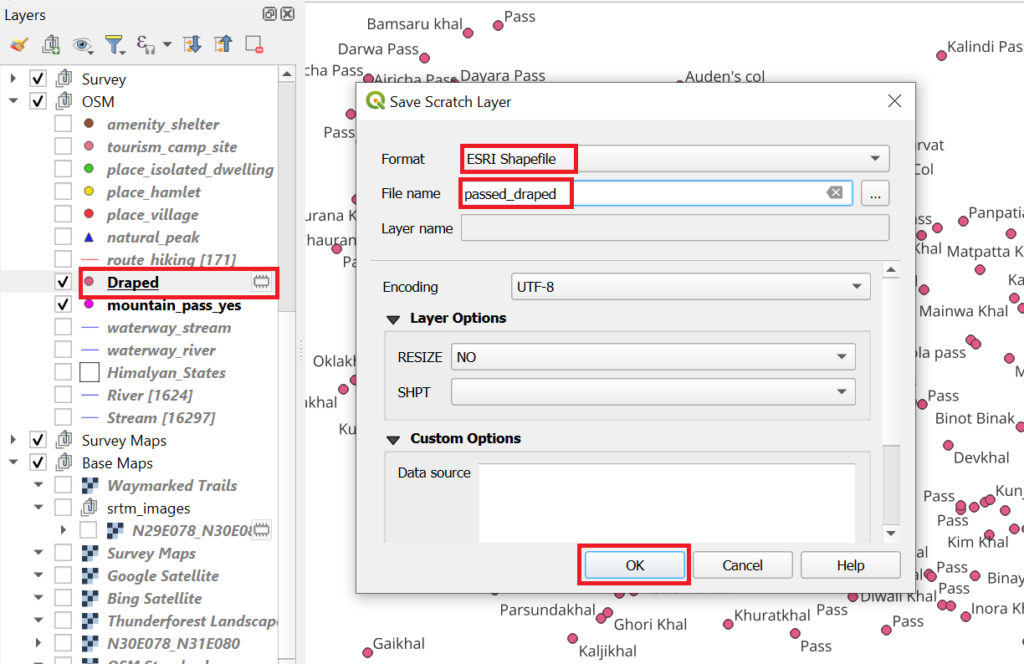
A new vector layer “Draped” is created which is a copy of “mountain_pass_yes” layer with “Z value” set to elevation. Click on the icon next to the layer and save it as an ESRI_Shapefile.
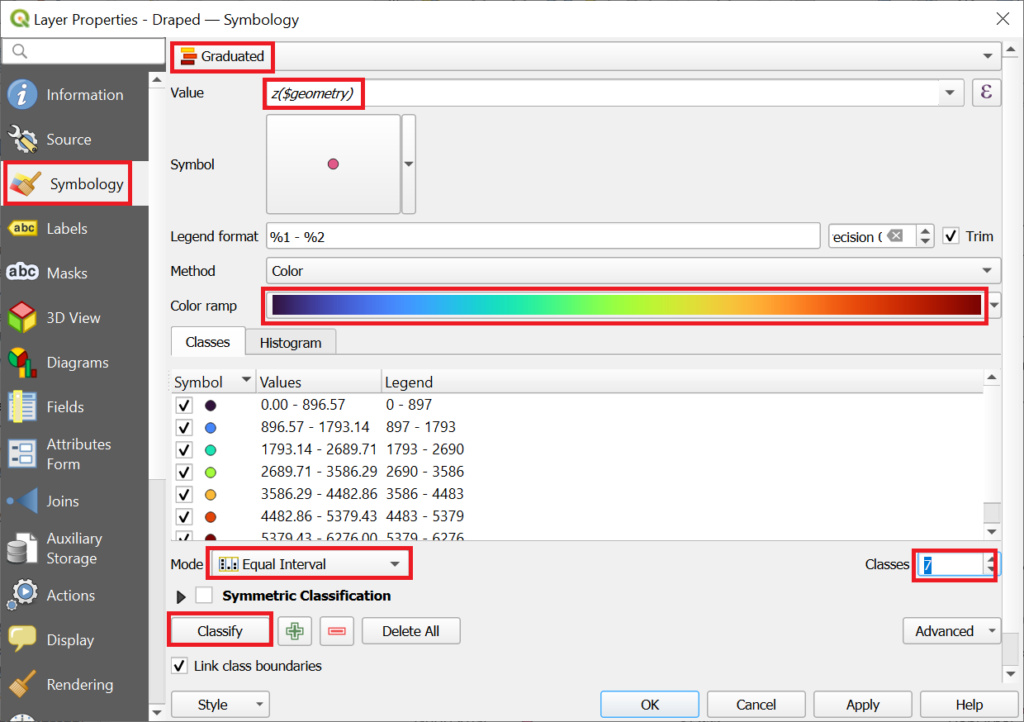
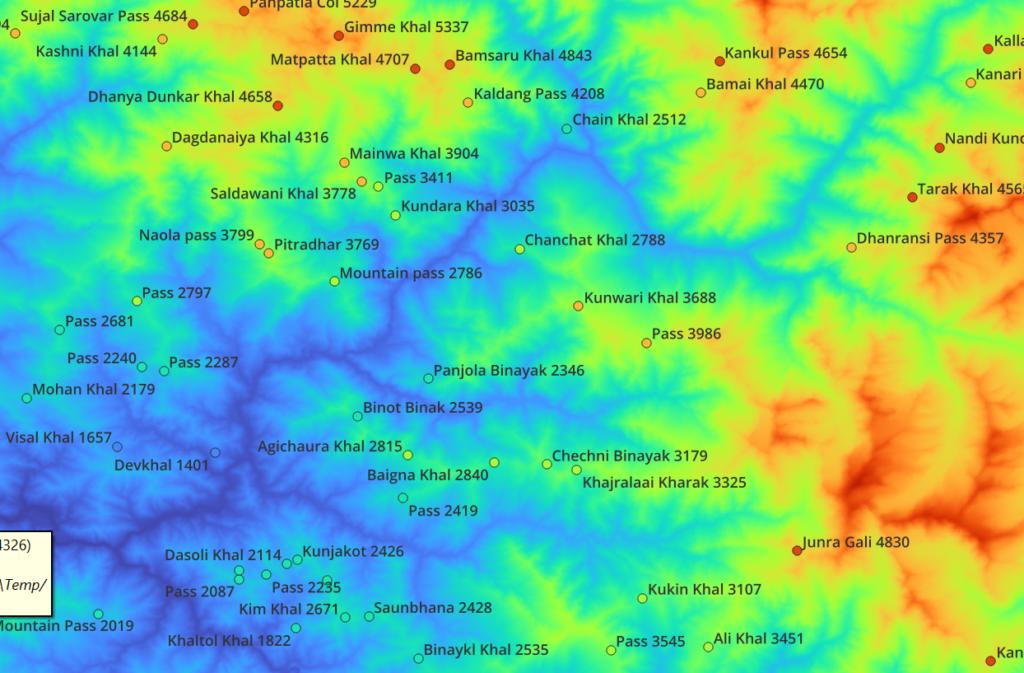
We can now visualize passes as per elevation. Click on Properties and set Symbology to “Graduated”, “Value=z($geometry)”, “Color ramp=Spectrum”, “Equal Interval”, “Classes=7”
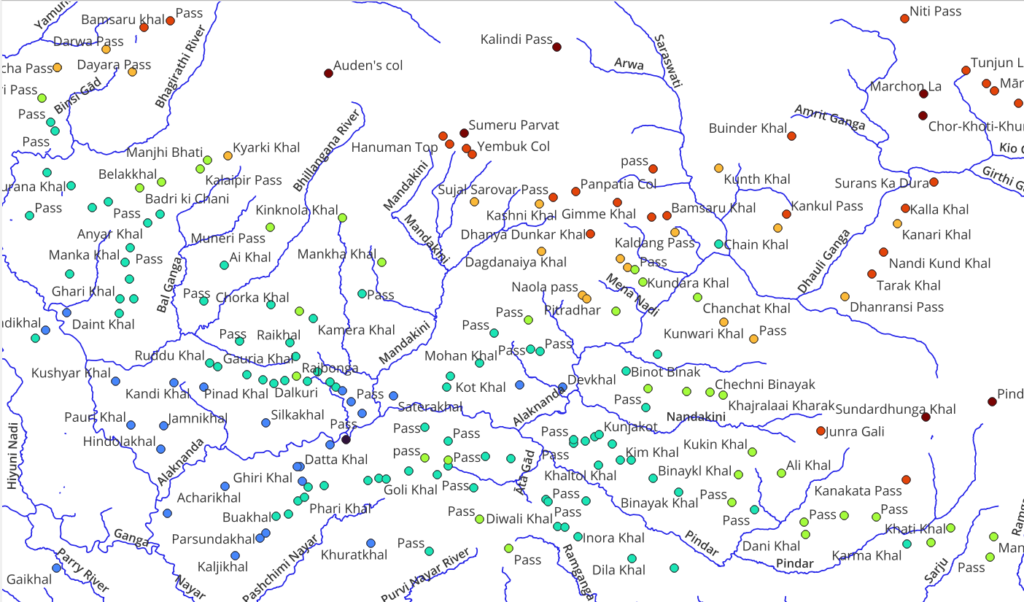
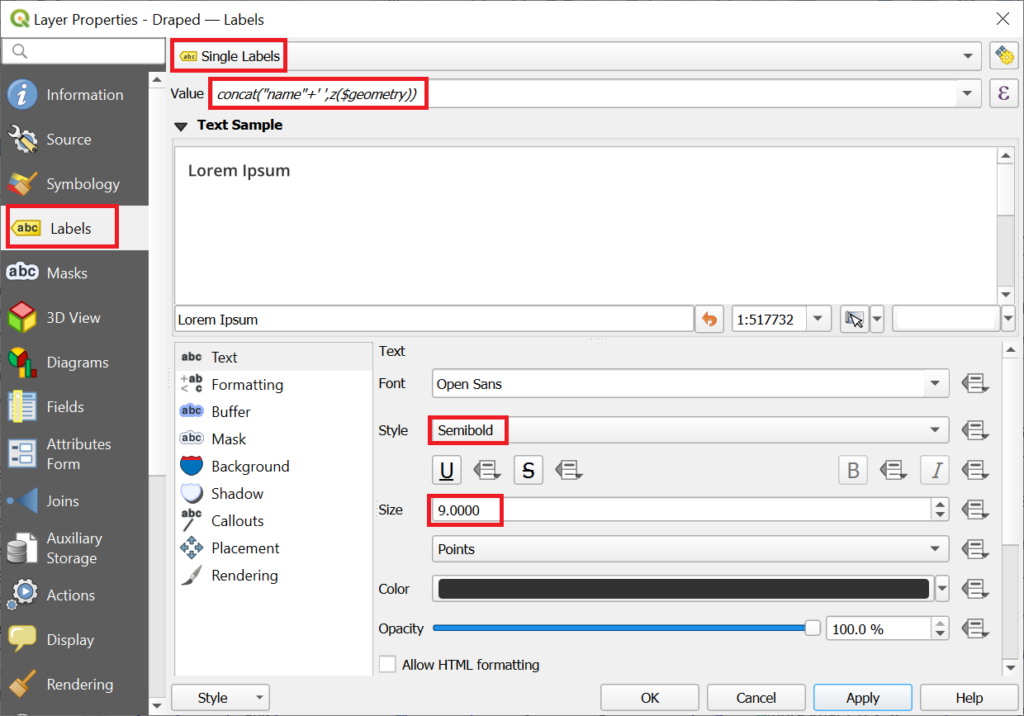
We can also display the exact elevation next to the name
Seasonal Traverses
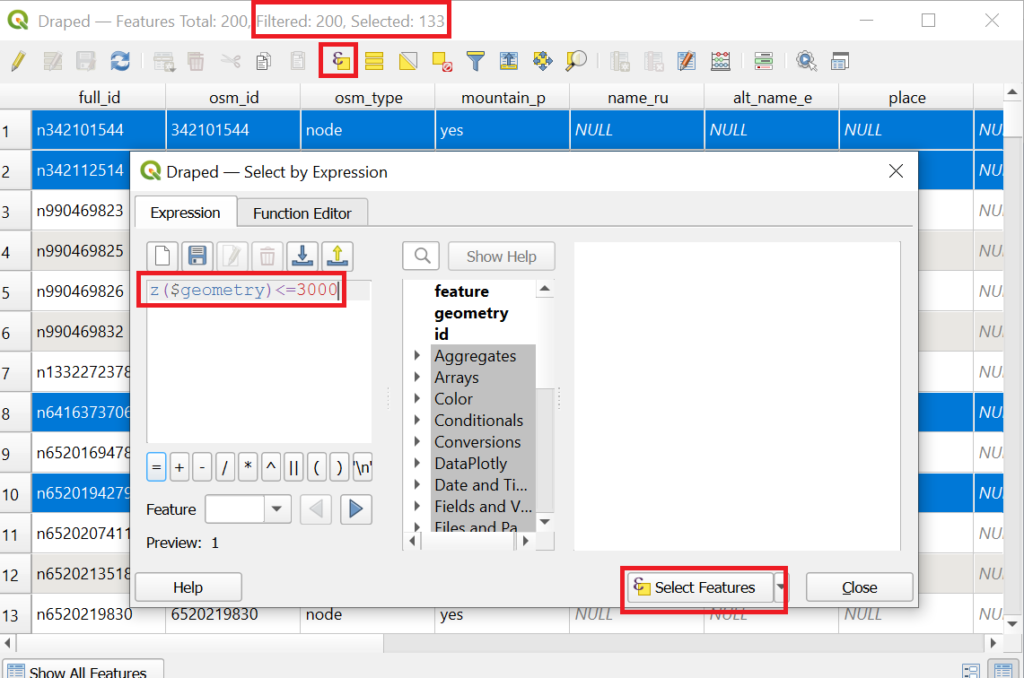
Let’s say we wish to plan a one week traverse in the month of April when the snowline is usually around 3000m. In this case we would want to focus on mountain passes below 3000m. Bring up the “Attribute Table” of the draped passes
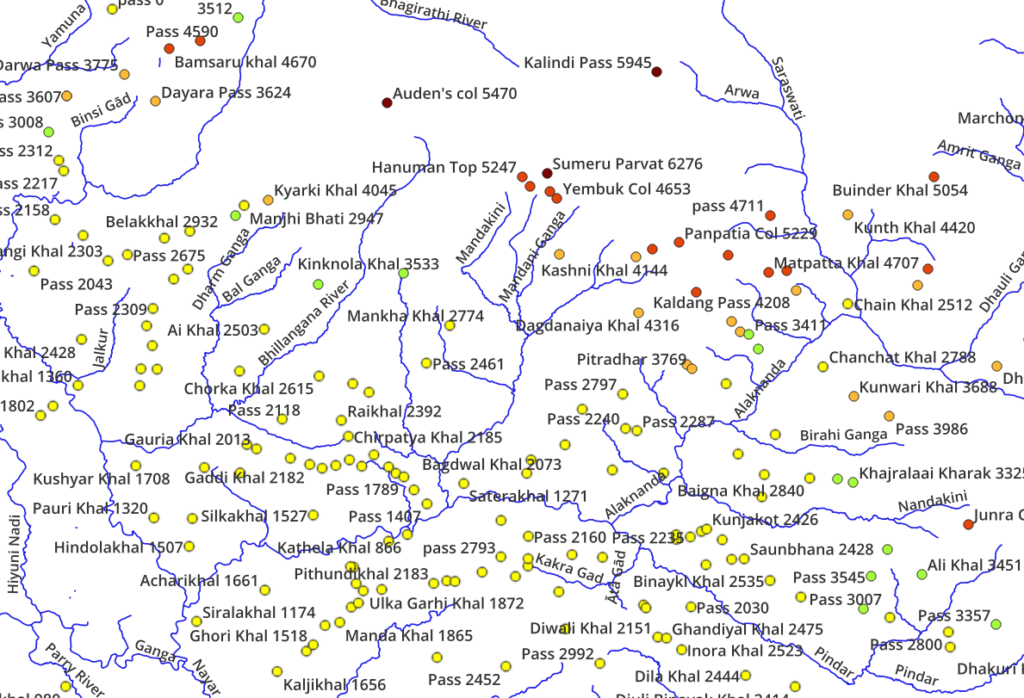
The sub-3000m passes are selected in the attributes window and highlighted in yellow in the map window. We can overlay hiking routes and now plan a continuous traverse which touches only the passes which are open in the month of April
We can also export the sub-3000m passes in a GPX file for easy planning on the phone
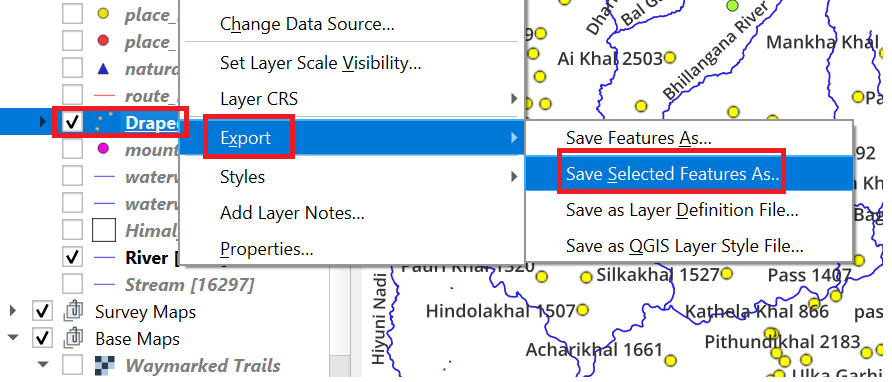
The exported passes can be downloaded in any app on the phone for planning a suitable traverse in April

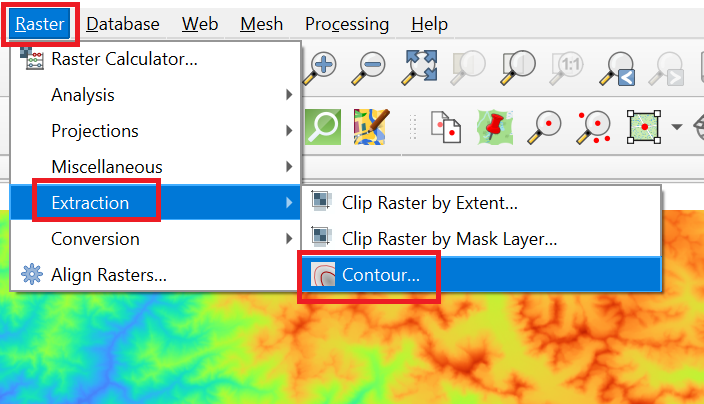
Generating Contours
We can also generate contours from the downloaded elevation data. Let’s generate 100m interval contours for the same region
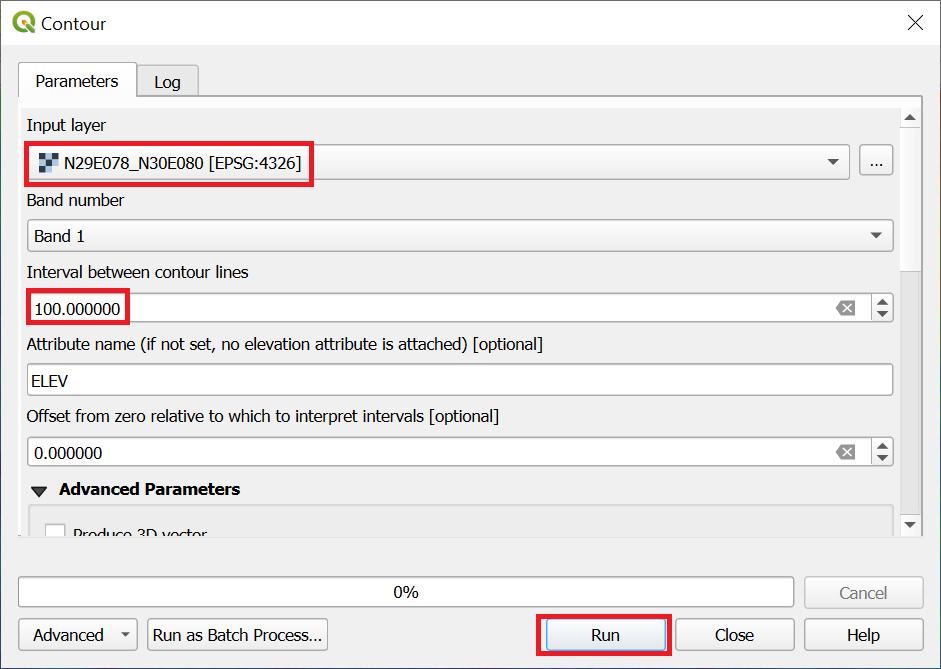
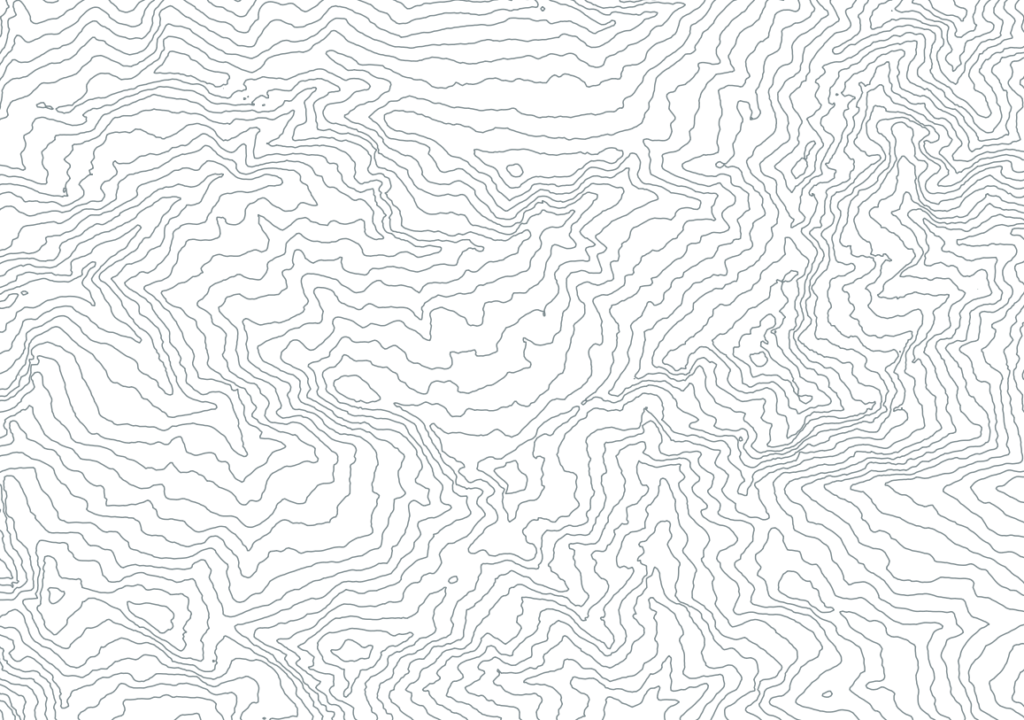
A new line vector layer is created for the generated contours
Set Labels as “ELEV” attribute to show the actual elevation
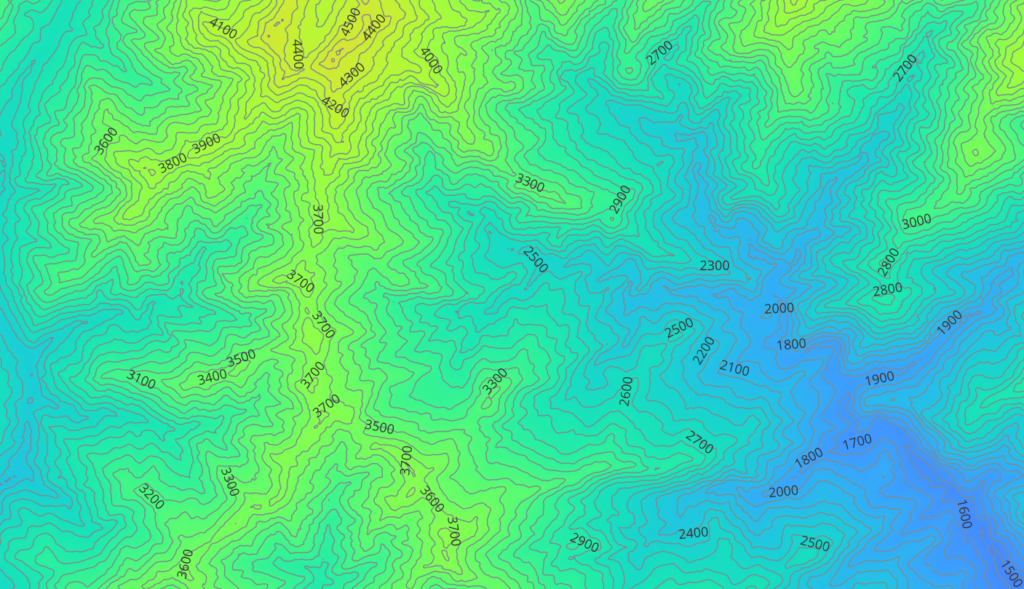
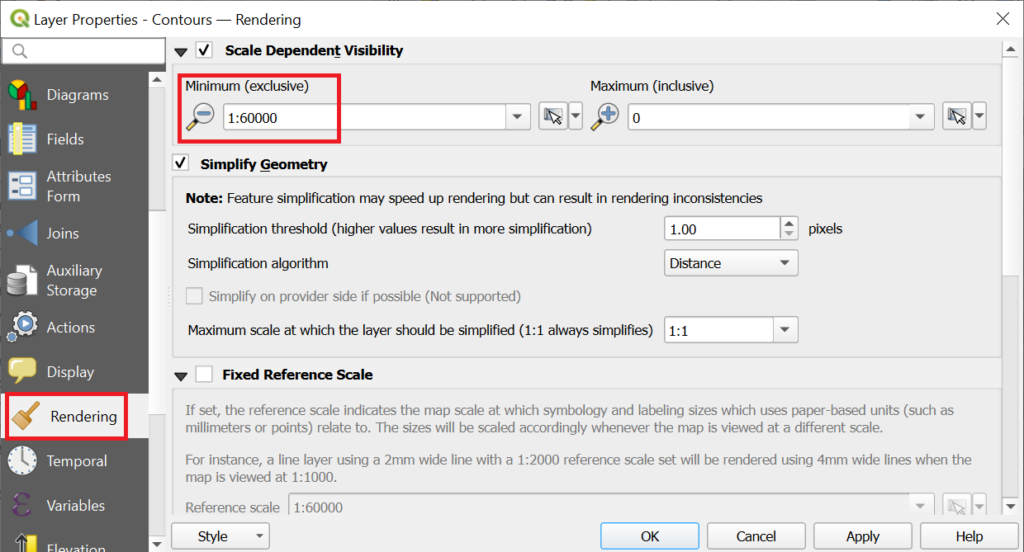
Only show contours at minimum 1:60K scale to reduce clutter on the screen while zooming out to higher scales
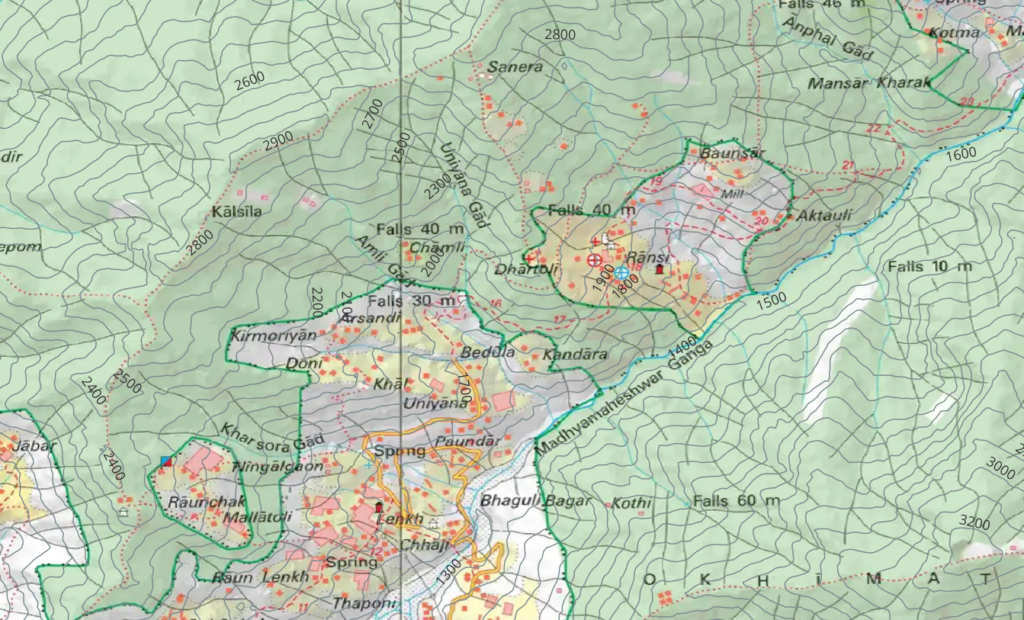
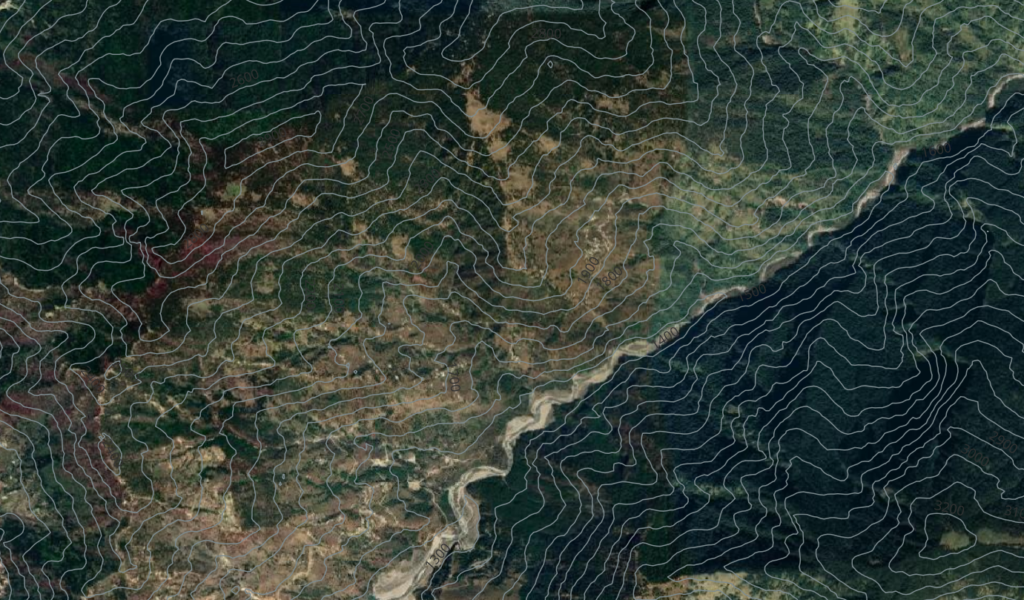
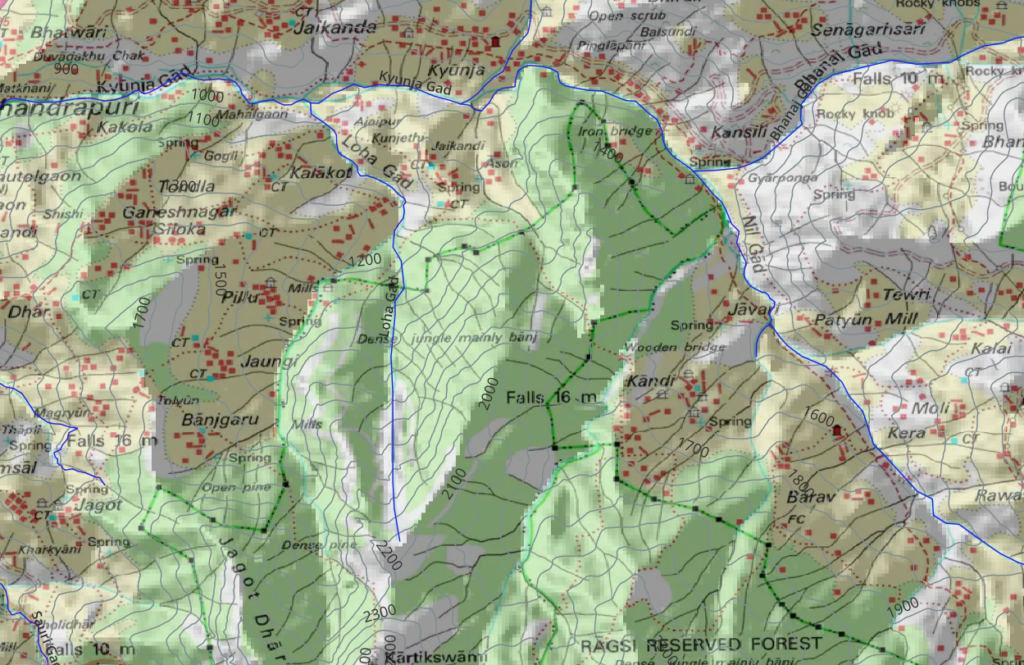
Contours can be overlaid over other base maps to add topography
Generating Hill Shades
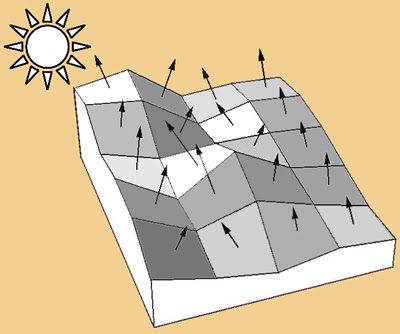
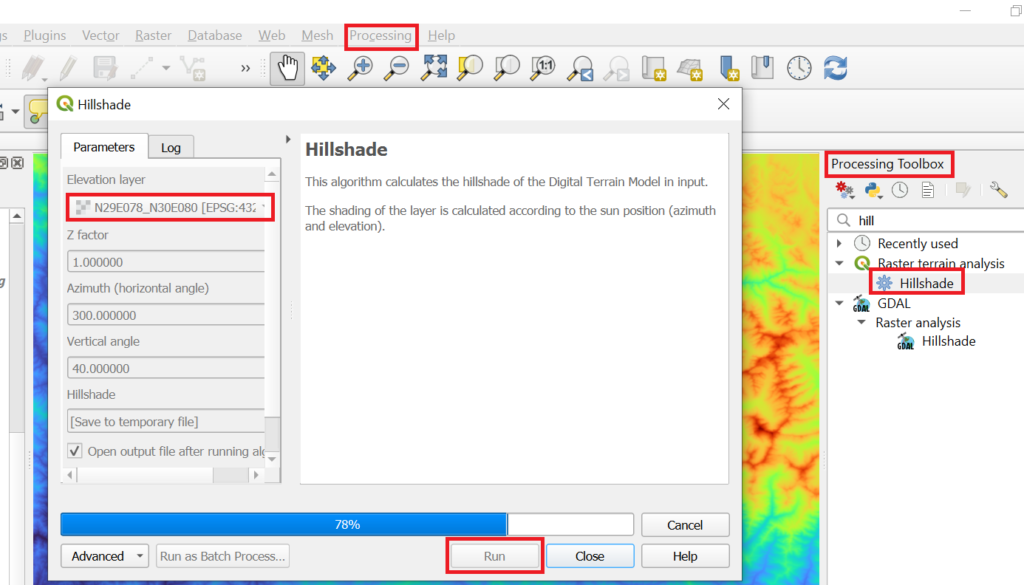
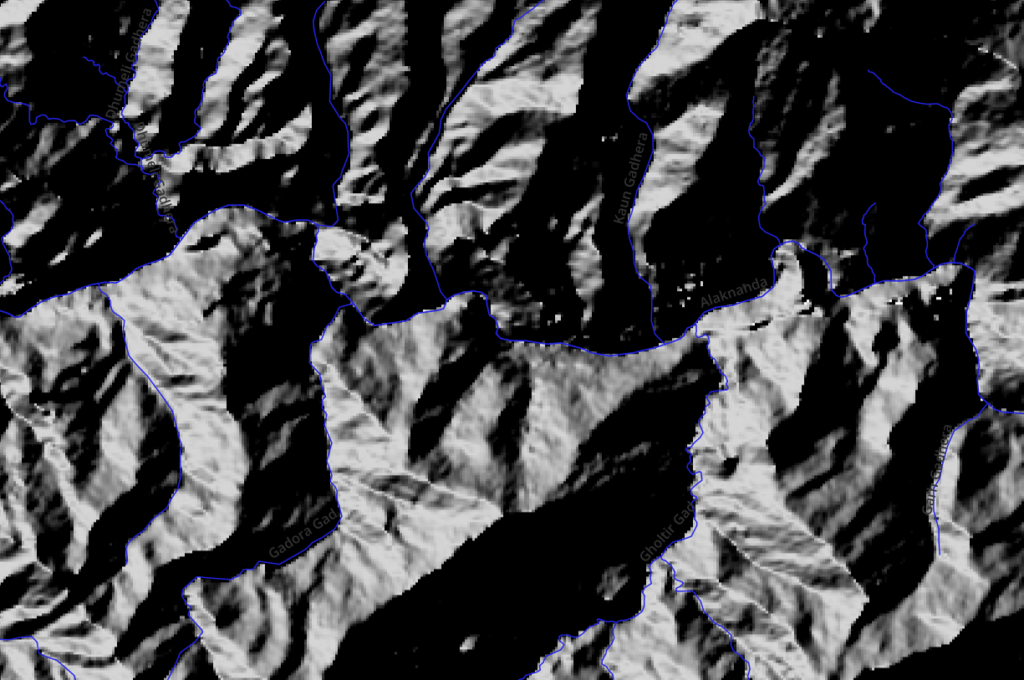
We can also generate hill shades from the elevation raster layer using the “Hillshade” function in the “Processing Toolbox”. This creates a new raster layer with hill shades.
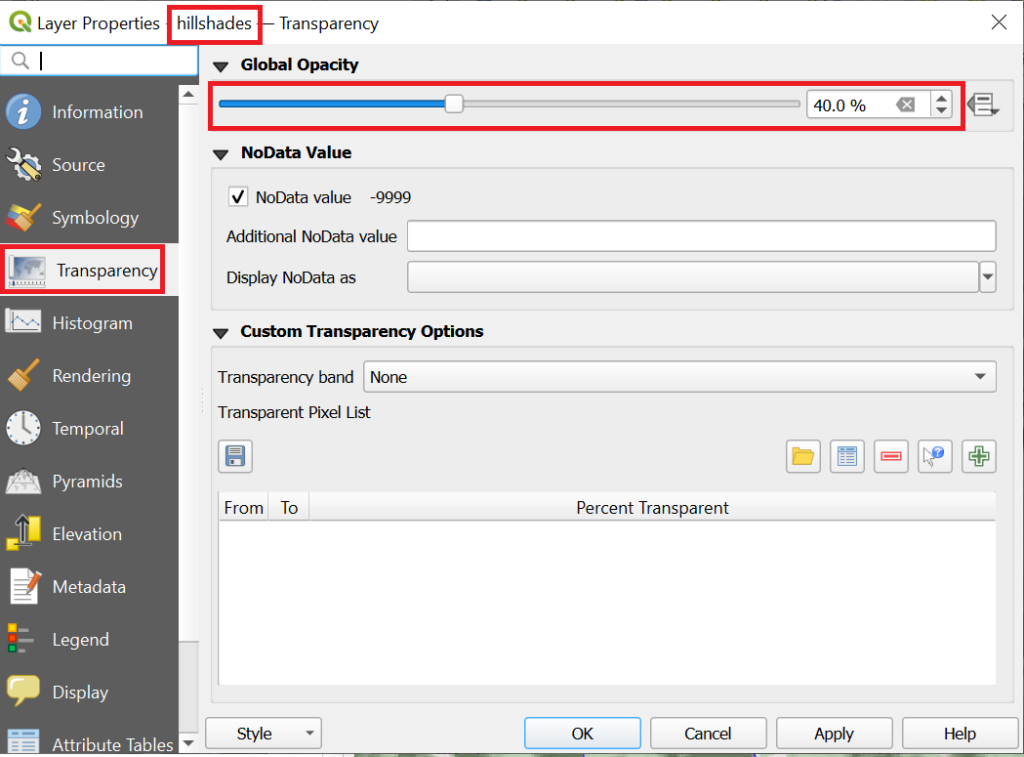
Set the “Transparency” of the hillshade raster layer to 40% and overlay over the OSM basemap to add hill shades
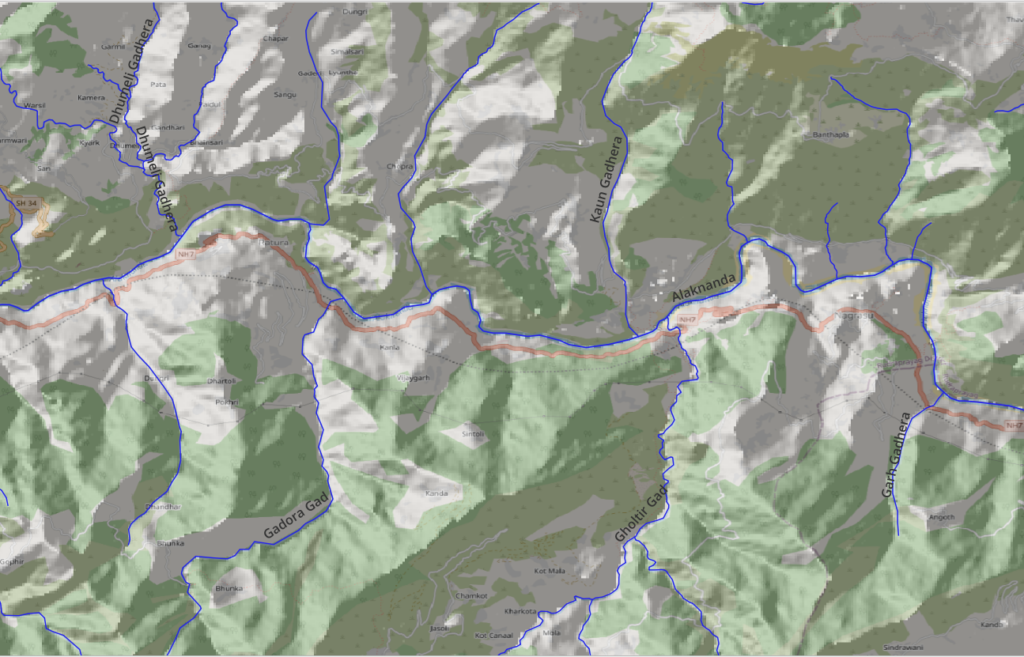
We can also add contours to create a proper topographic map
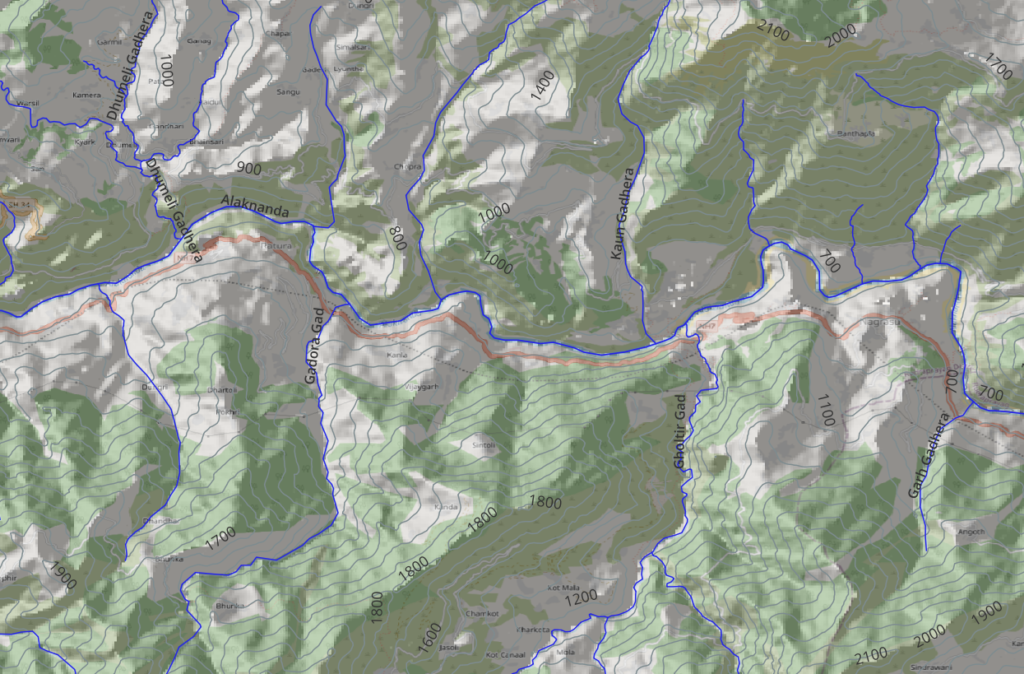
Overlay Survey + Hillshades + Contour to create a proper topographic map
Elevation Profile
Let’s add elevation data to the POIs of our simple Himalayan traverse planned in the previous chapter. Run the “Drape” function from the “Processing Toolbox” on the “Khati to Sitel” vector point layer. A new vector layer “Draped” is created. Rename it as “Khati to Sitel Draped” and save it as “ESRI shapefile” format
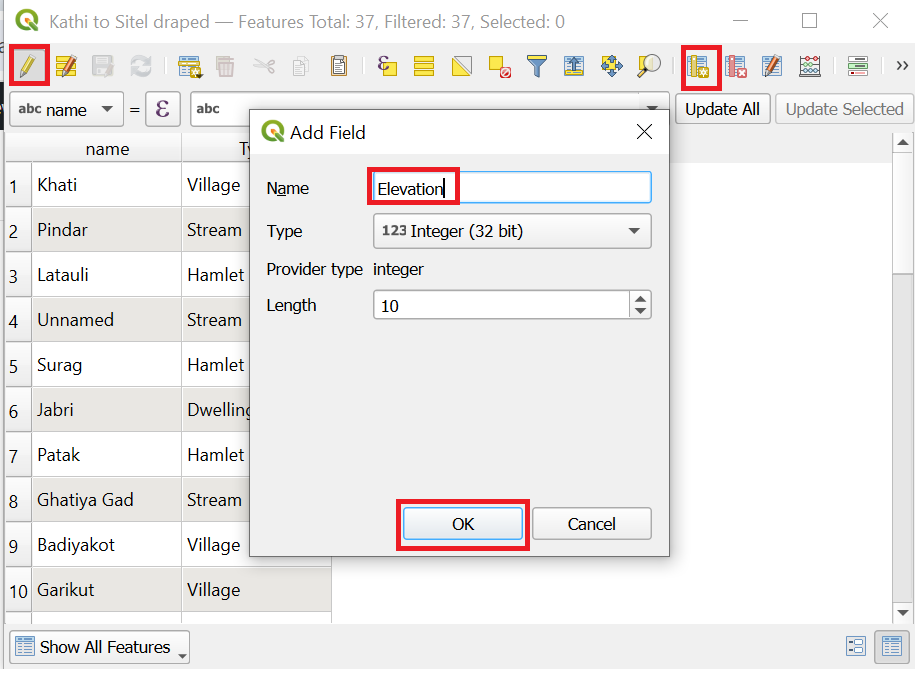
Right click on the new layer and bring up the “Attribute Table”. Click icon “Toggle Edit” and “New Field” with name ” “Name=”Elevation”.
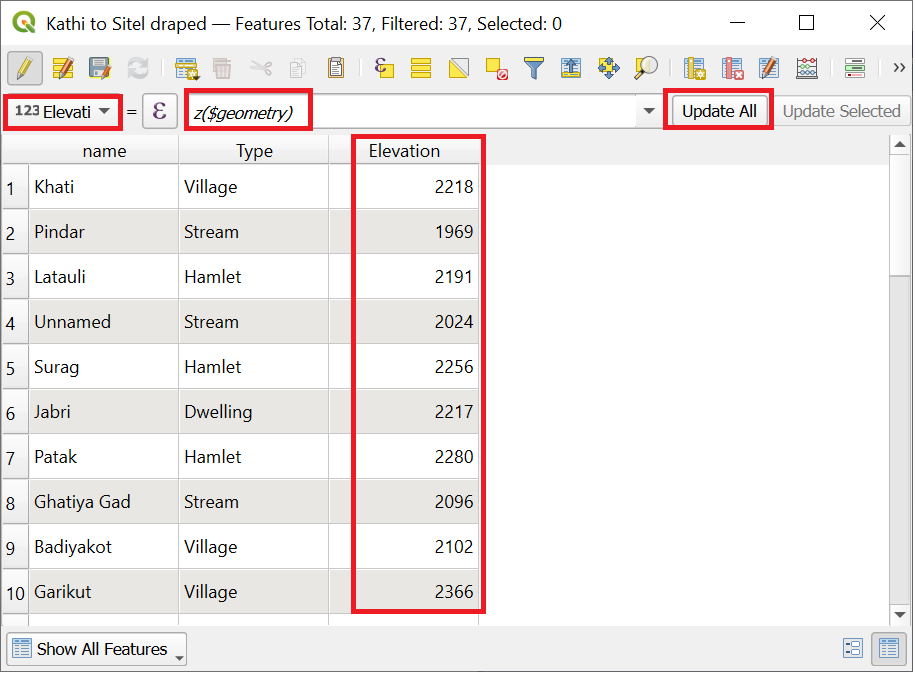
Set “Elevation” field equal to”z($geometry)” and click “Update All” to copy the elevation retrieved from the DEM layer into this field
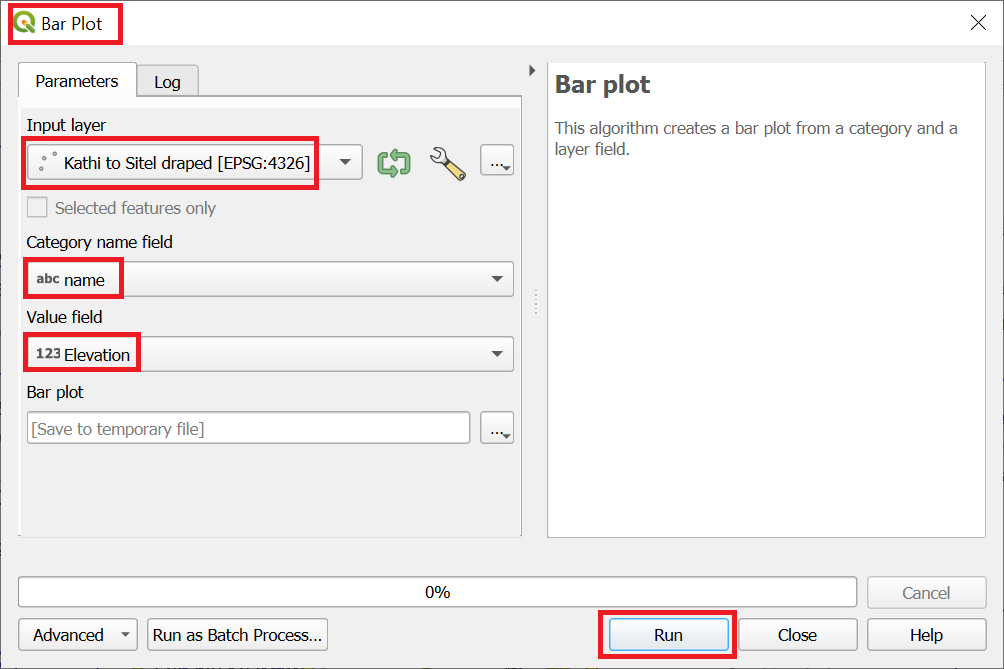
Now run the “Bar Plot” function from the “Processing Toolbox” on the draped POI layer. “Category=name” and “Value=Elevation”
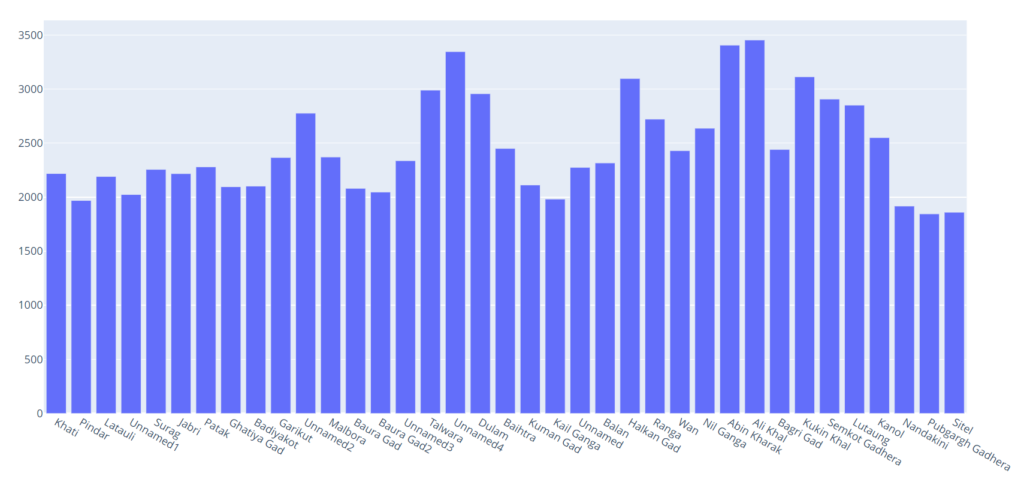
Click on the html results link and open up the bar chart in your browser to see an elevation profile of your Himalayan traverse
Assignment
Download all glaciers in the Ladakh and visualize them as per elevation