
Now that we have QGIS up and running let’s start looking at some publicly available data sets for the Western Indian Himalayas which we can import and analyze in QGIS.
In November 2020 the National Remote Sensing Centre (NRSC) part of Indian Space Research Organization (ISRO) created a Glacial Lakes atlas of the Indus River Basin identifying more then 5000 high altitude lakes:
https://lib.icimod.org/record/35038
You can download the data set in CSV format over here:
https://tinyurl.com/ISRO-glacial-lakes
To import the data in QGIS, choose “Layer”, “Add Layer”, “Add delimited text layer”. Select the downloaded CSV file in the File Name and ensure Lon, Lat and CRS are set properly in the Geometry Definition section. See Image 3 below. Click Add to add a new vector layer in the QGIS main screen showing 5000 glacial lakes


Geographic Attributes
Let’s now take a closer look at the imported data set. Zoom in to any part of the Western Himalayas to some of the individual lakes and you will notice that many of them have already been mapped in OSM (by myself and a team of volunteers). See image 1 below.
We can also verify the actual presence of the lakes using a different base layer. Go to “Web”, “QuickMapServices” and select “Google Satellite” to bring up a hires satellite map. Disable (uncheck) the OpenTopoLayer and verify the presence of various individual lakes on the satellite map. See image 2 below.
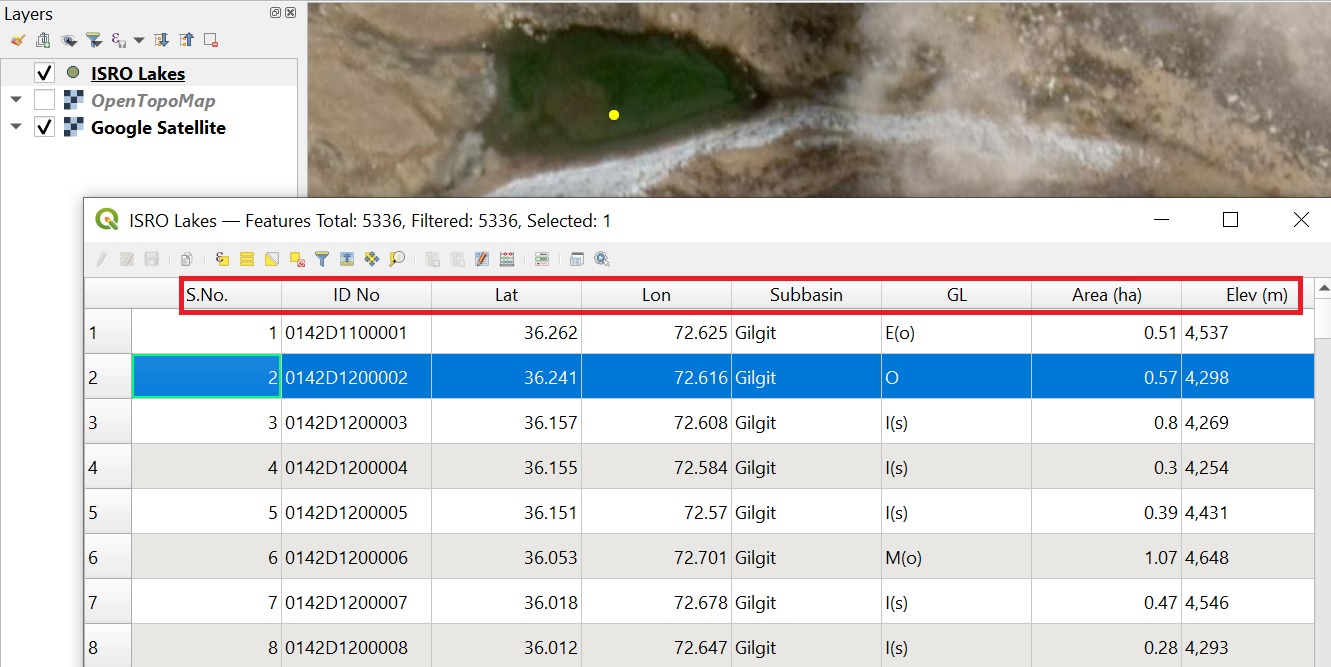
We can also view the imported dataset in tabular form by right clicking on the “ISRO_Lakes” layer and choose “Open Attribute Table”. We see various attributes for each lake:
ID No – unique ID
Lat / Lon – the latitude / longitude allowing QGIS to show it in the exact location on the map
Subbasin – the subbasin of the main Indus basin in which the lake is located
GL – type of lake (Refer to the Atlas PDF above for more info)
Area – size of the lake
Elev – altitude of the lake
You can right click on any lake in the table and choose “Zoom to feature” to show the selected lake on the map in the main QGIS screen


Analyzing data
QGIS allows us to easily filter or select any subset of the imported data based on its attributes. Click the “Select Features” icon on the toolbar to bring up the Selection window. In the middle window choose “Fields and Values” and choose “Area”. Complete the expression by typing ” > 20″ in the left window and click “Select Features” button to select 132 lakes which are larger than 20 hectares.
Choose “Show Selected Features” in the Attributes table to show only these 132 lakes. The same “Selected” lakes are highlighted in bright yellow in the main QGIS map screen. Zoom into any of these selected lakes on the satellite map to verify that these are indeed the larger lakes.


Visualizing data
QGIS allows us to visualize our geographic data sets in powerful ways. Let’s say for example we want to color the lakes as per the subbasin to which they belong. Right click on the “ISRO_Lakes” layer and choose “Properties”. Open the “Symbology” tab and choose “Categorized” based on Value “Subbasin”. Click “Classify” to automatically assign a different color to each value of the attribute and “OK” to show the lakes as per subbasin in the main QGIS window.
Let’s now take a different look at our lakes as per their elevation. Open the “Symbology” tab and choose ” Graduated” based on “Elev” attribute. Choose the Rainbow color ramp below and choose “Equal Interval” mode. Click “Classify” to automatically categorize the available elevations in 5 equal categories of increasing altitude.
Finally ensure to save your QGIS project before exiting.


Assignment
Submit the form below acknowledging the fact that you have gone through the above tutorial.
Those interested to analyze more data in QGIS can use below interesting datasets for the Western Himalayas:
Peaks by IMF:
https://www.indmount.org/IMF/getPeaks?type=op
Peaks by Japanese alpine club:
http://jactokai.sakura.ne.jp/shibuhp/modules/pico/index.php/content0012.html
Human settlements by NGA:
ftp://ftp.nga.mil/pub2/gns_data