Contents
- Atlas of Glacial lakes
- Importing Data
- Using Attributes
- Visualization
Atlas of Glacial Lakes

In November 2020 the National Remote Sensing Centre (NRSC) part of Indian Space Research Organization (ISRO) created a Glacial Lakes atlas of the Indus River Basin identifying more then 5000 high altitude lakes. The objective of the project is to improve the extent and accessibility of water resources information and strengthen institutional capacity to enable improved water resources planning and management across India.
Importing Data
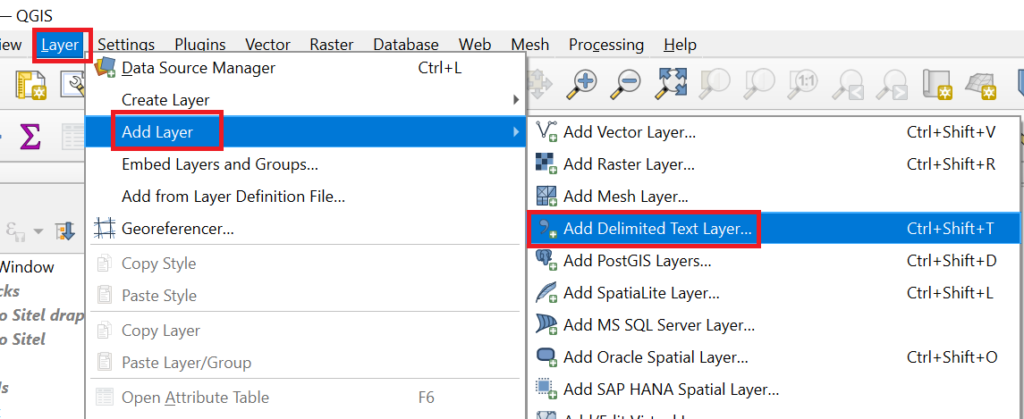
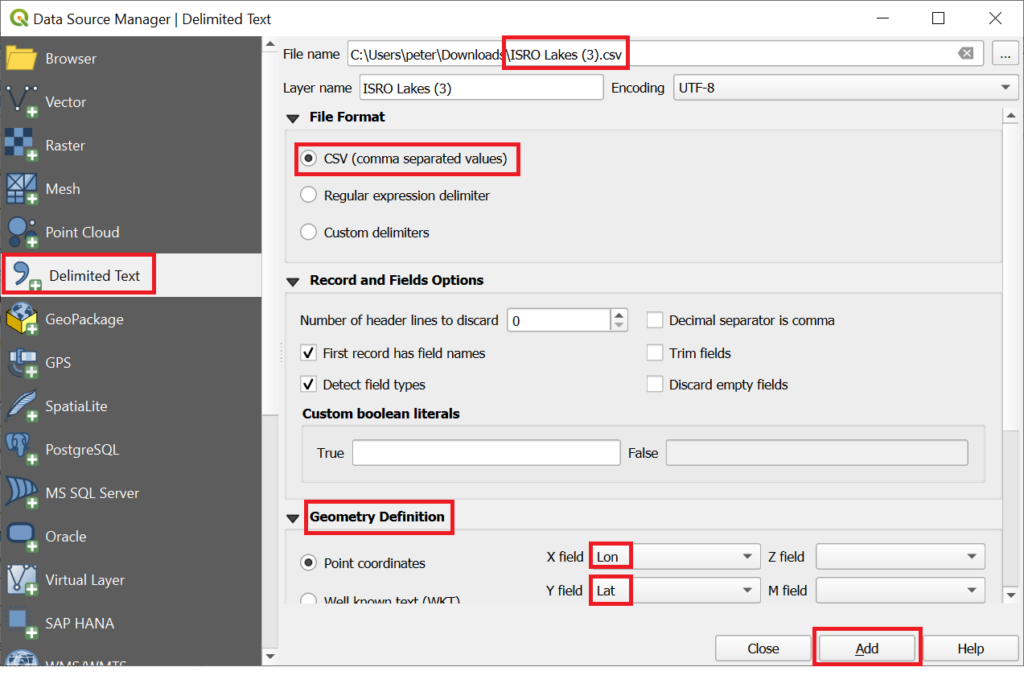
You can download the atlas over here in CSV format. QGIS supports many different formats. Choose “Layer”, “Add Layer”, “Add Delimited Text Layer”
The atlas includes the coordinates of the lakes in the lon, lat columns. QGIS automatically detects the same while importing
A new vector point layer is created with 5335 glacial lakes
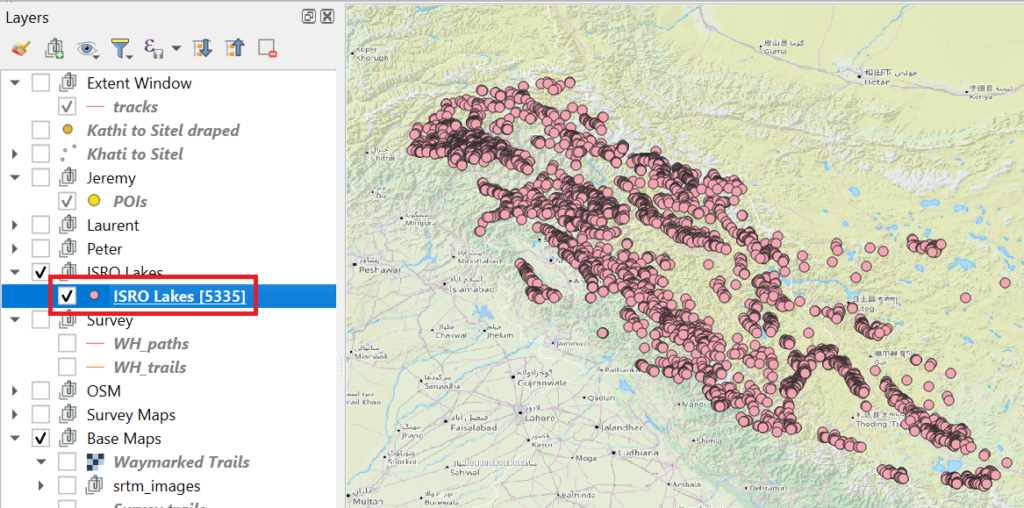
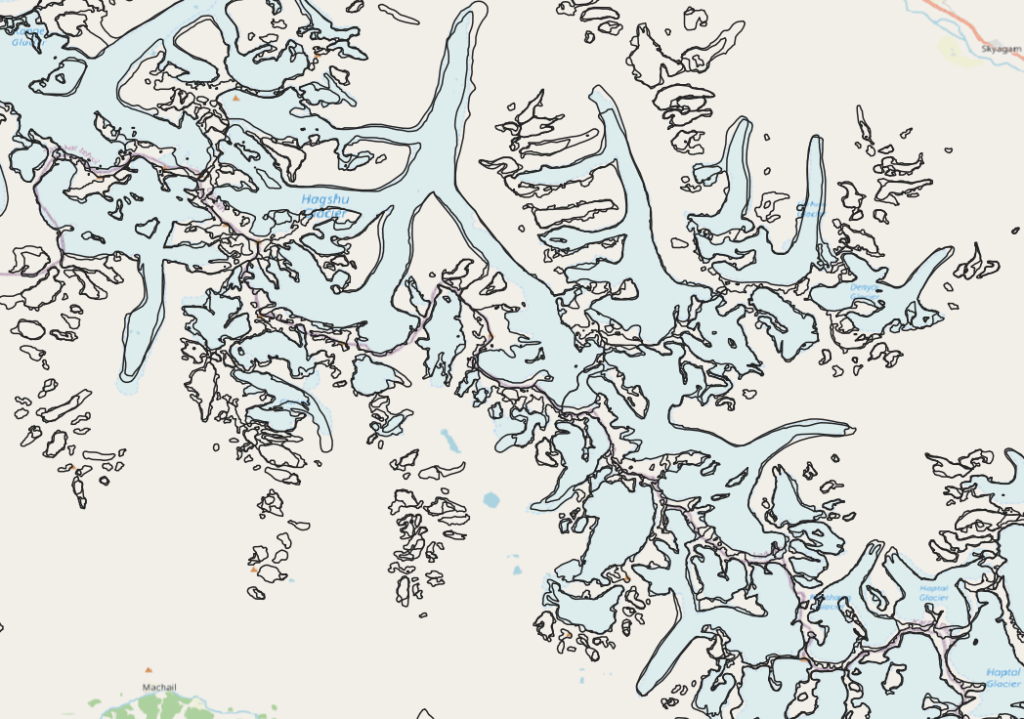
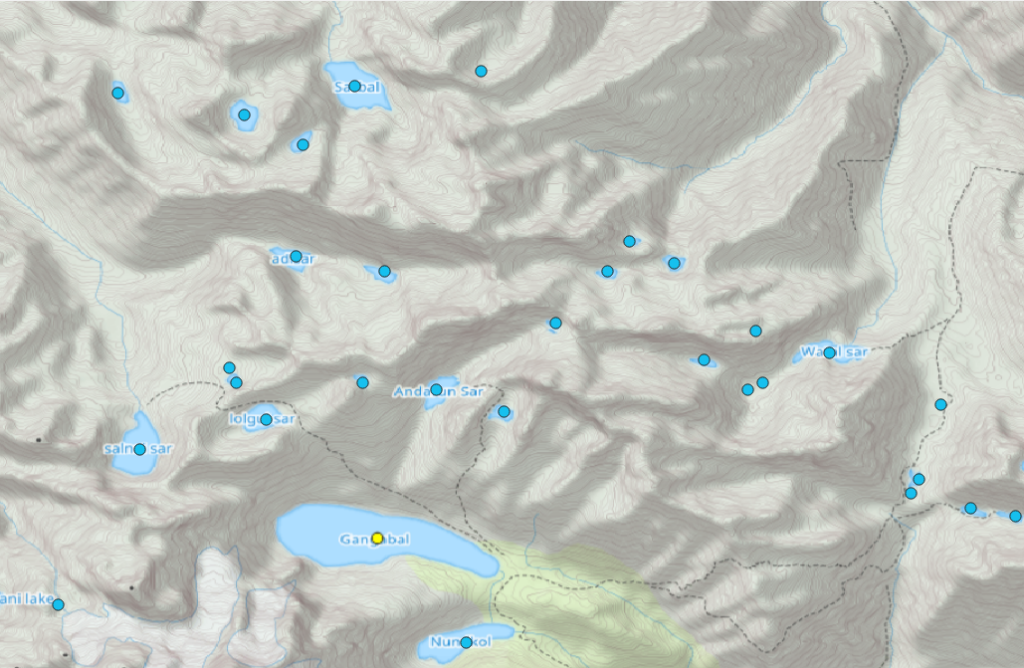
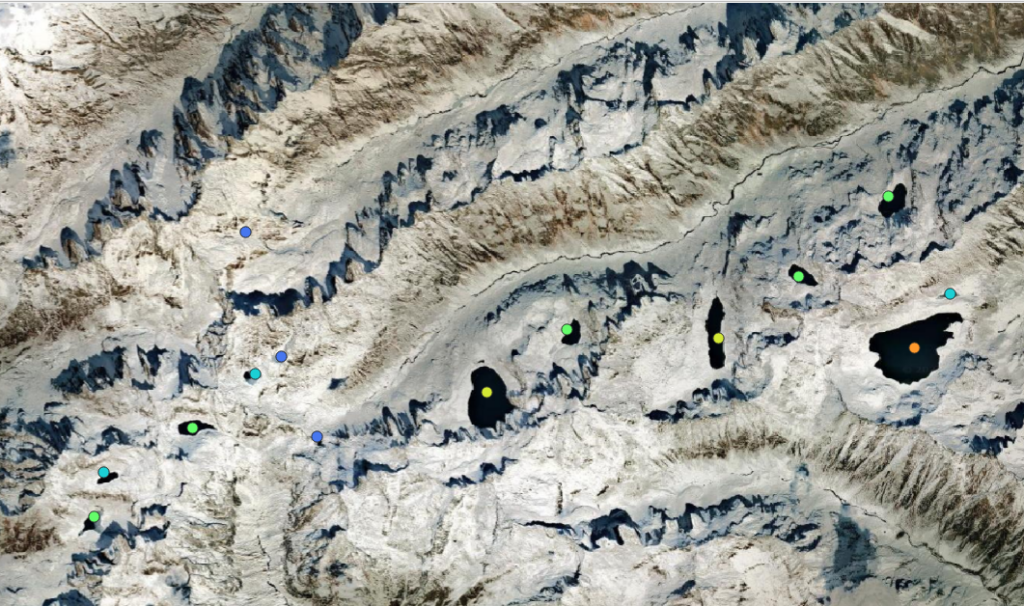
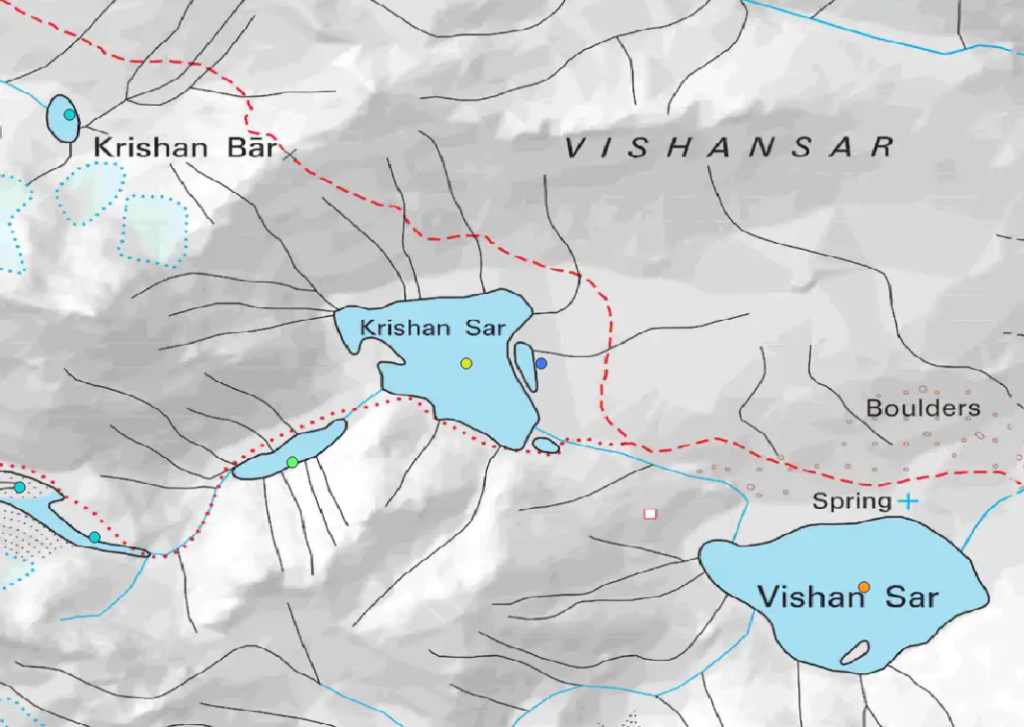
Zoom in to see individual lakes
Using Attributes
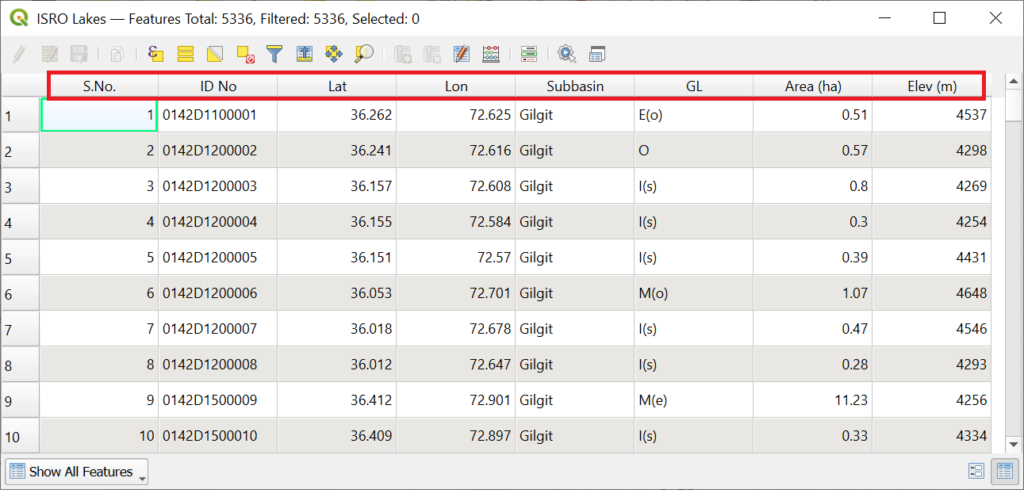
Open the “Attributes Table” to view the various attributes for the lakes
- Lat, Lon – location of the lake
- Subbasin – in which river basin the lake drains
- GL – type of lake – refer legend in atlas
- Area – size of the lake (ha)
- Elevation – altitude of the lake (m)
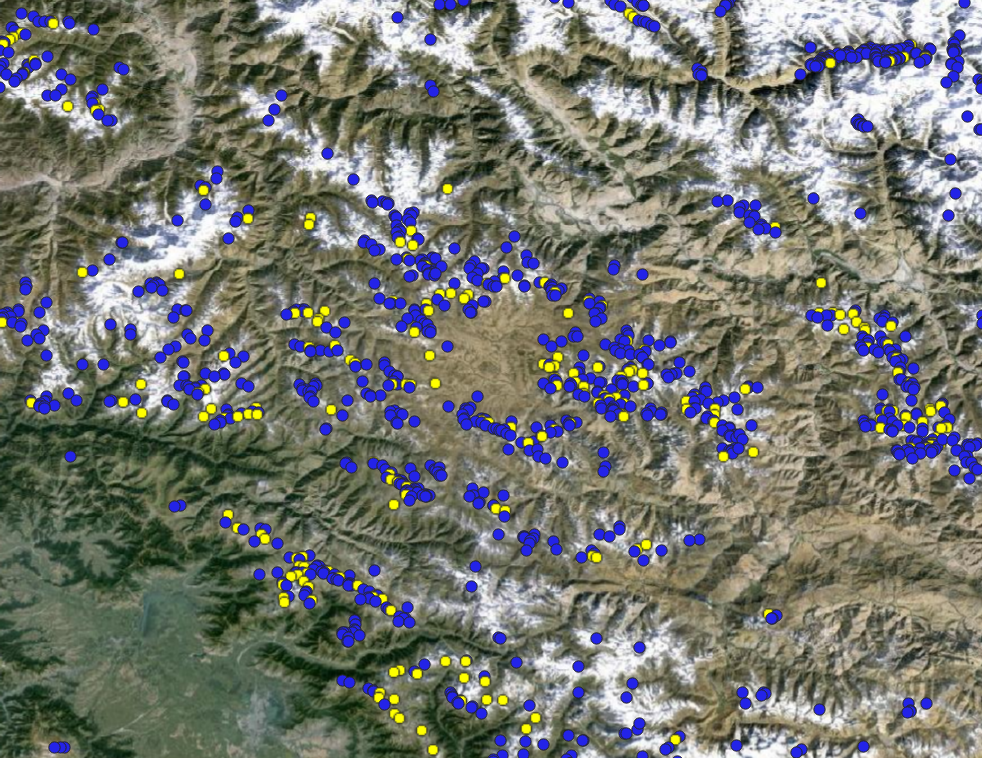
Select all larger glacial lakes with a size above 5 hectare
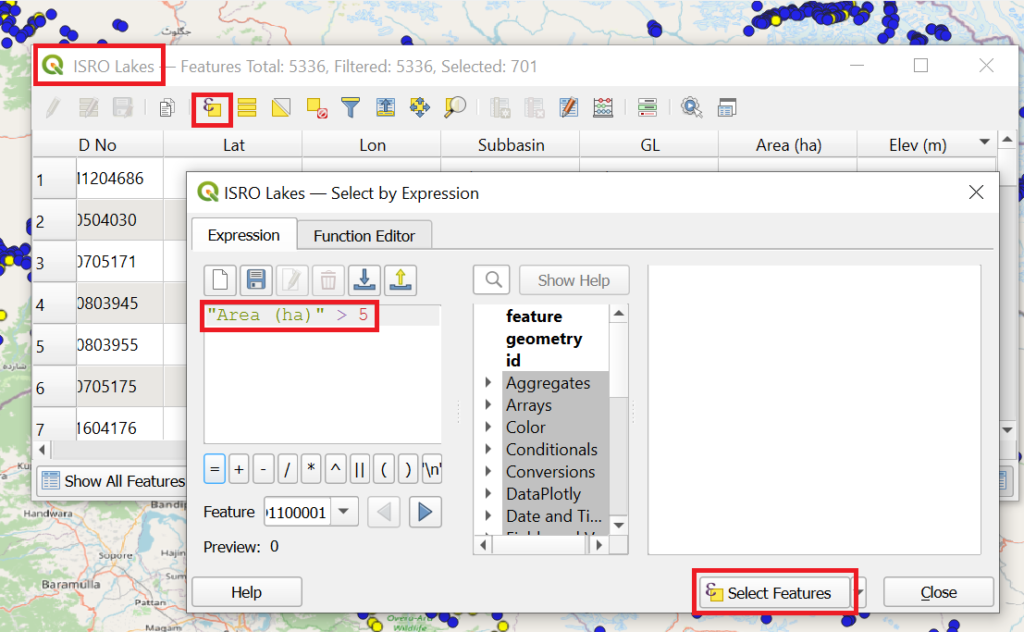
Selected lakes are highlighted in yellow
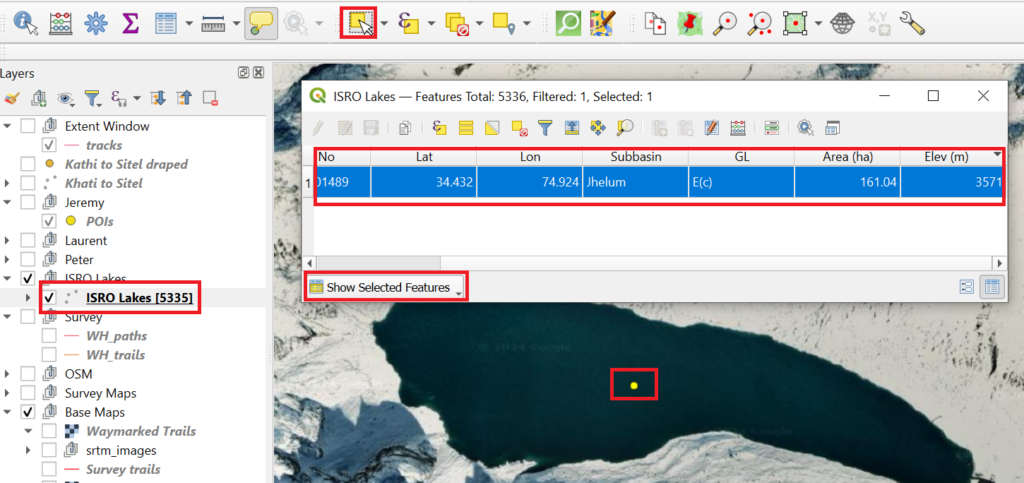
Alternatively you can select individual lakes on the map using the “Select Feature” tool and filter on “Show Selected Features” to see the attributes of the corresponding glacial lake
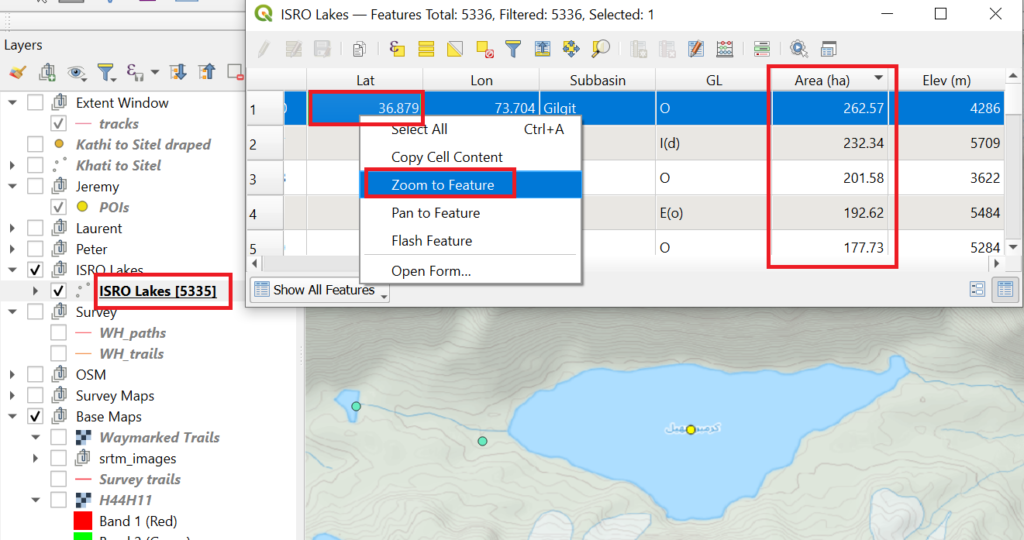
Sort the lakes on “Area”, right click on the first entry and choose “Zoom to feature” to see the largest lake in the Indus river basin
Visualization
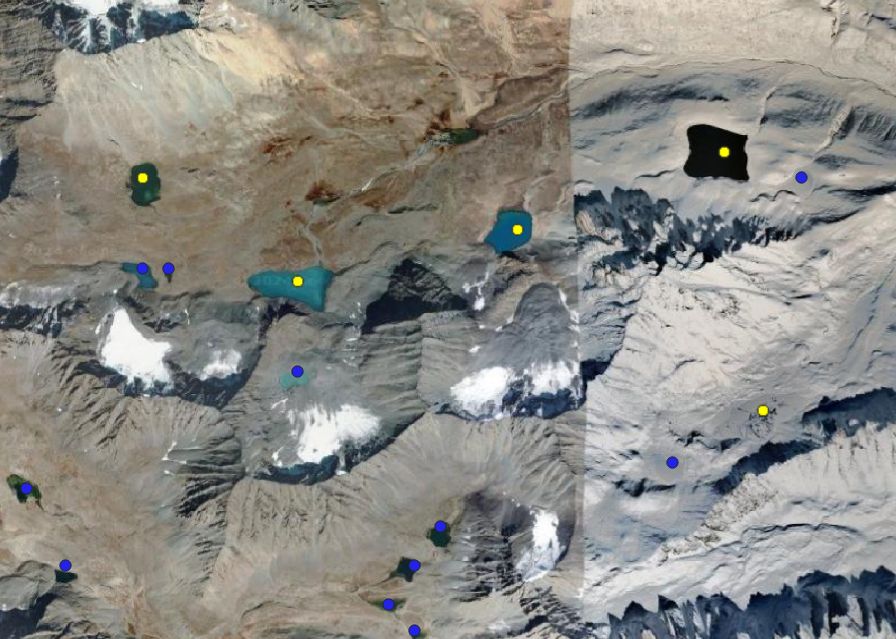
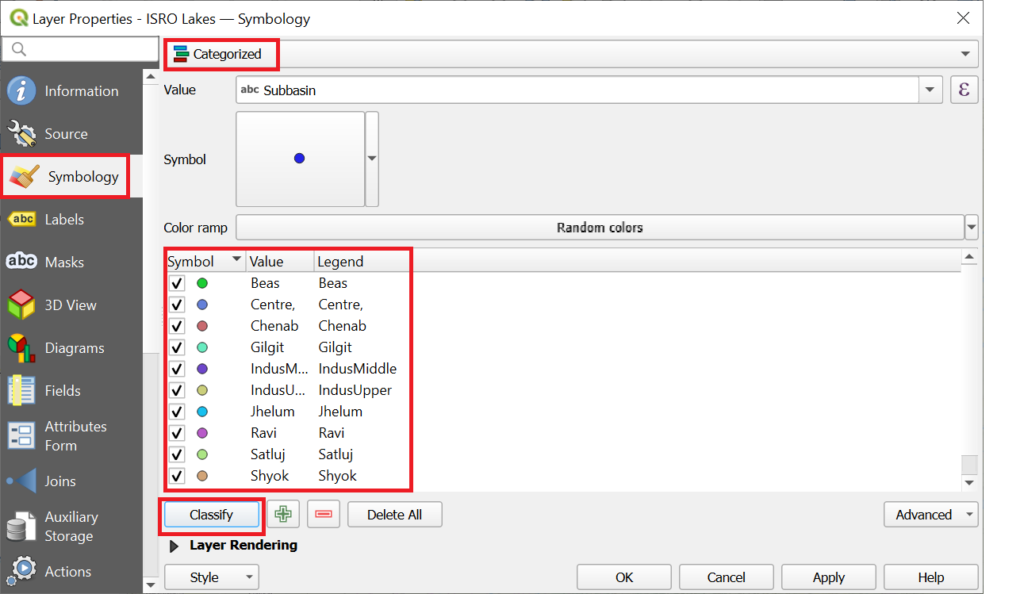
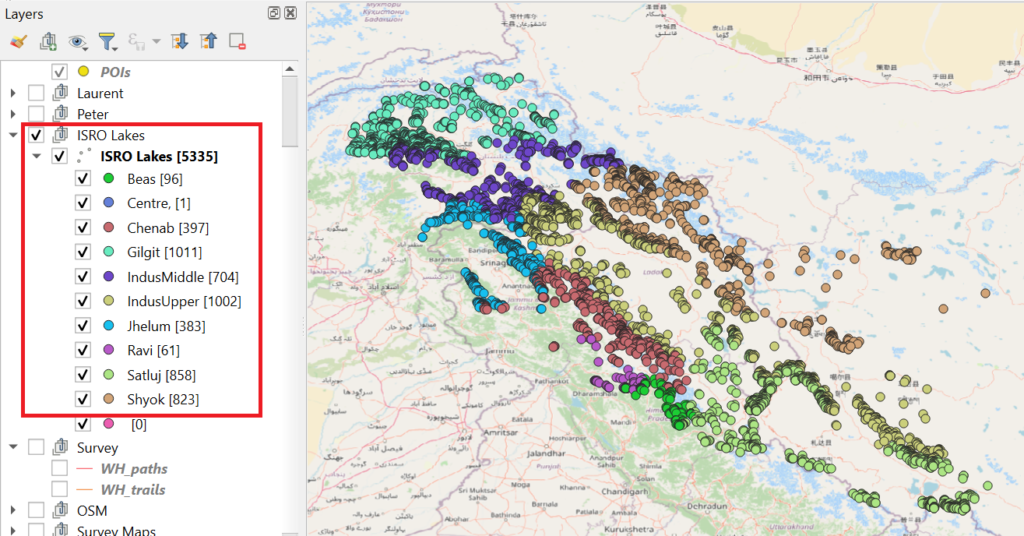
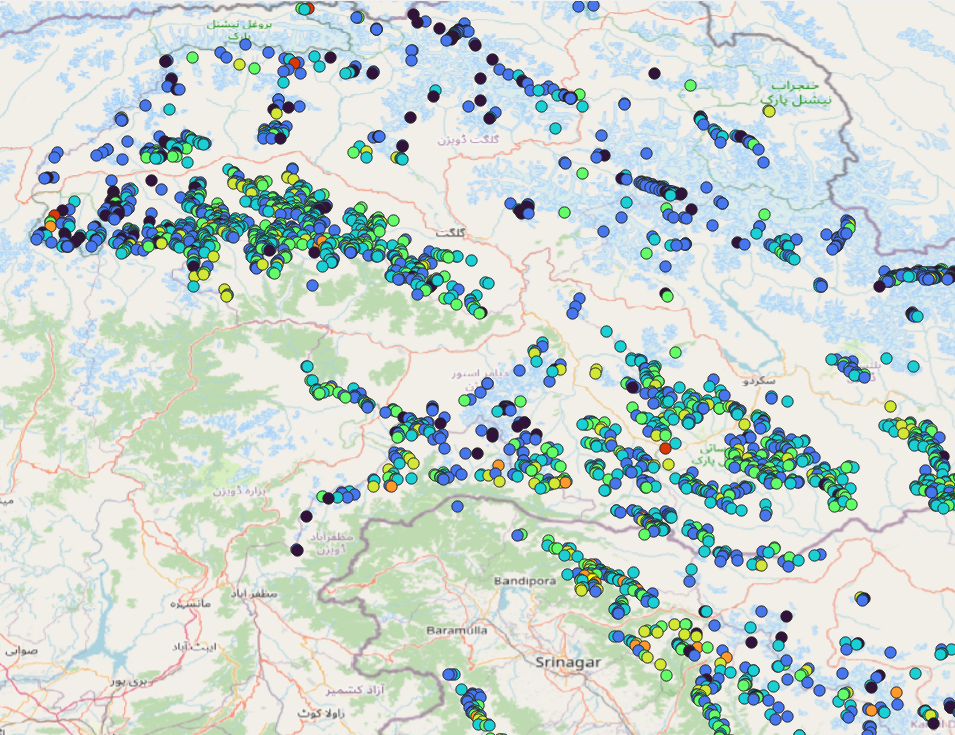
We can visualize the lakes in many different ways. One is to classify them as per the river basin they are flowing in
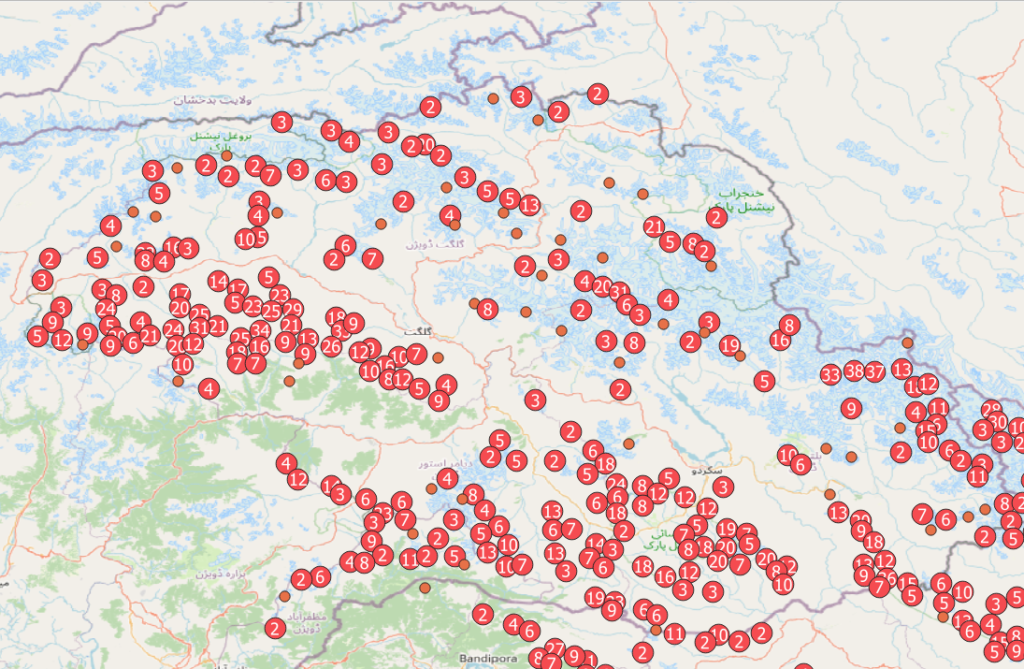
Use “Point Cluster” to view the lakes in clusters
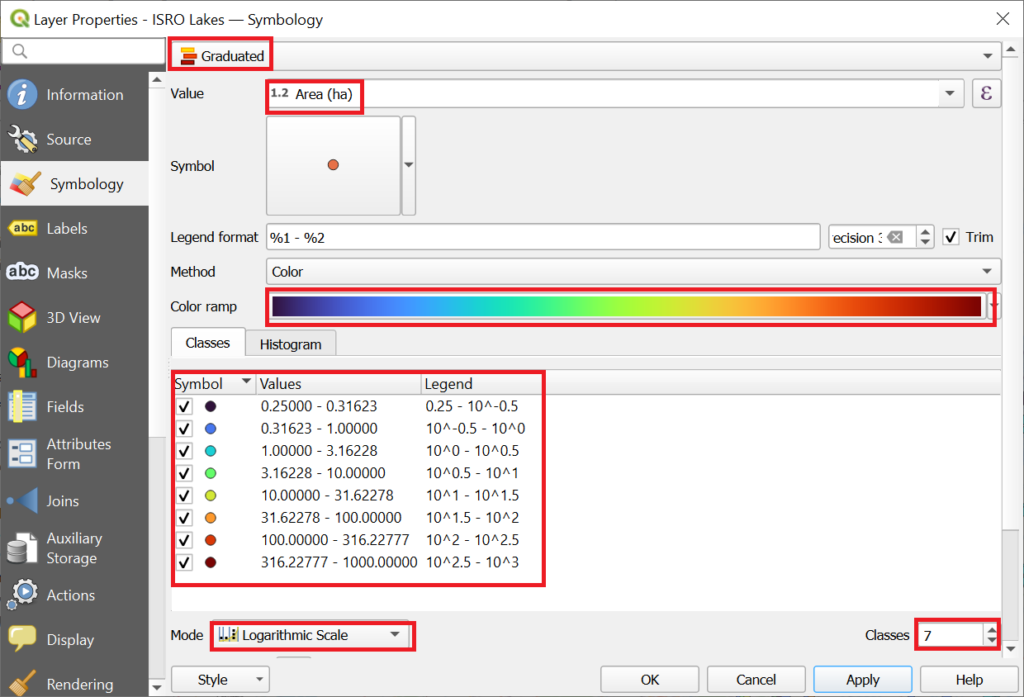
Use “Graduated” to show the lakes as per size (logarithmic scale, 7 intervals) to easily identify larger lakes
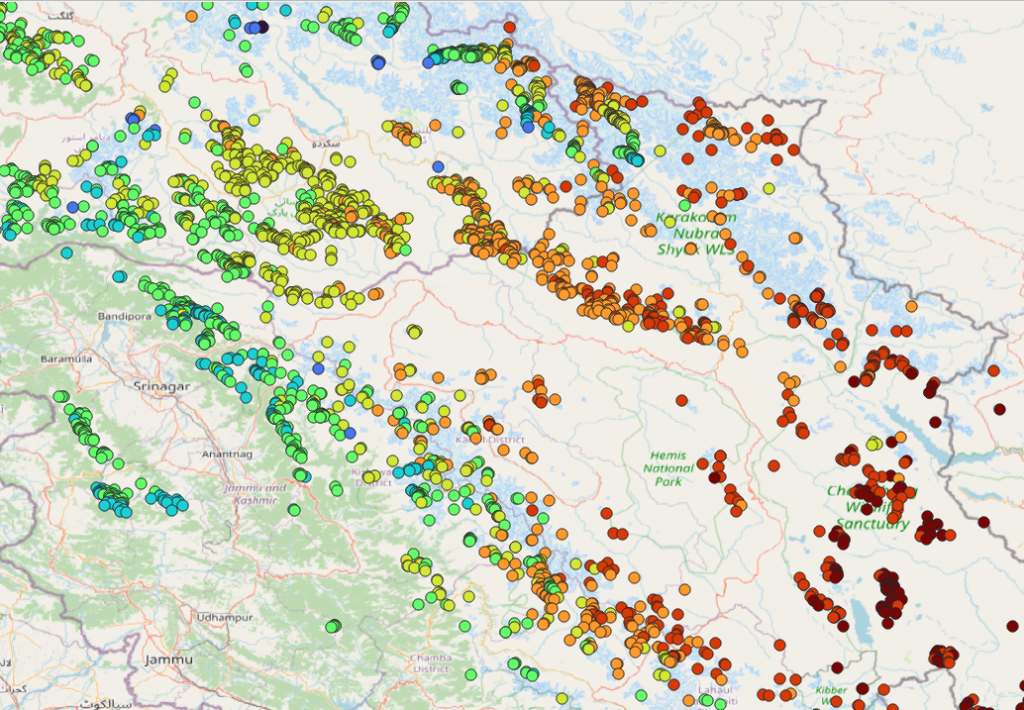
Similarly we can view the lakes as per elevation / altitude, turbo spectrum, 7 equal intervals
Assignment
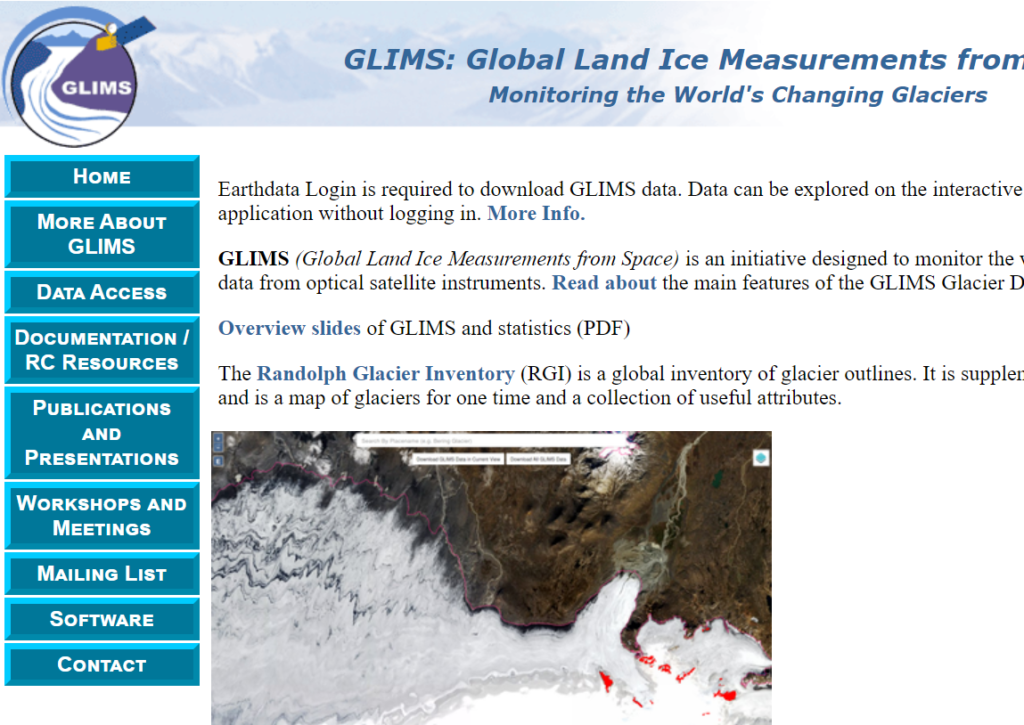
Import the latest glacier boundaries from NASA Earthdata glims.org website and visualize in various ways in QGIS. Compare recent glacier boundaries with those on OSM and Survey maps