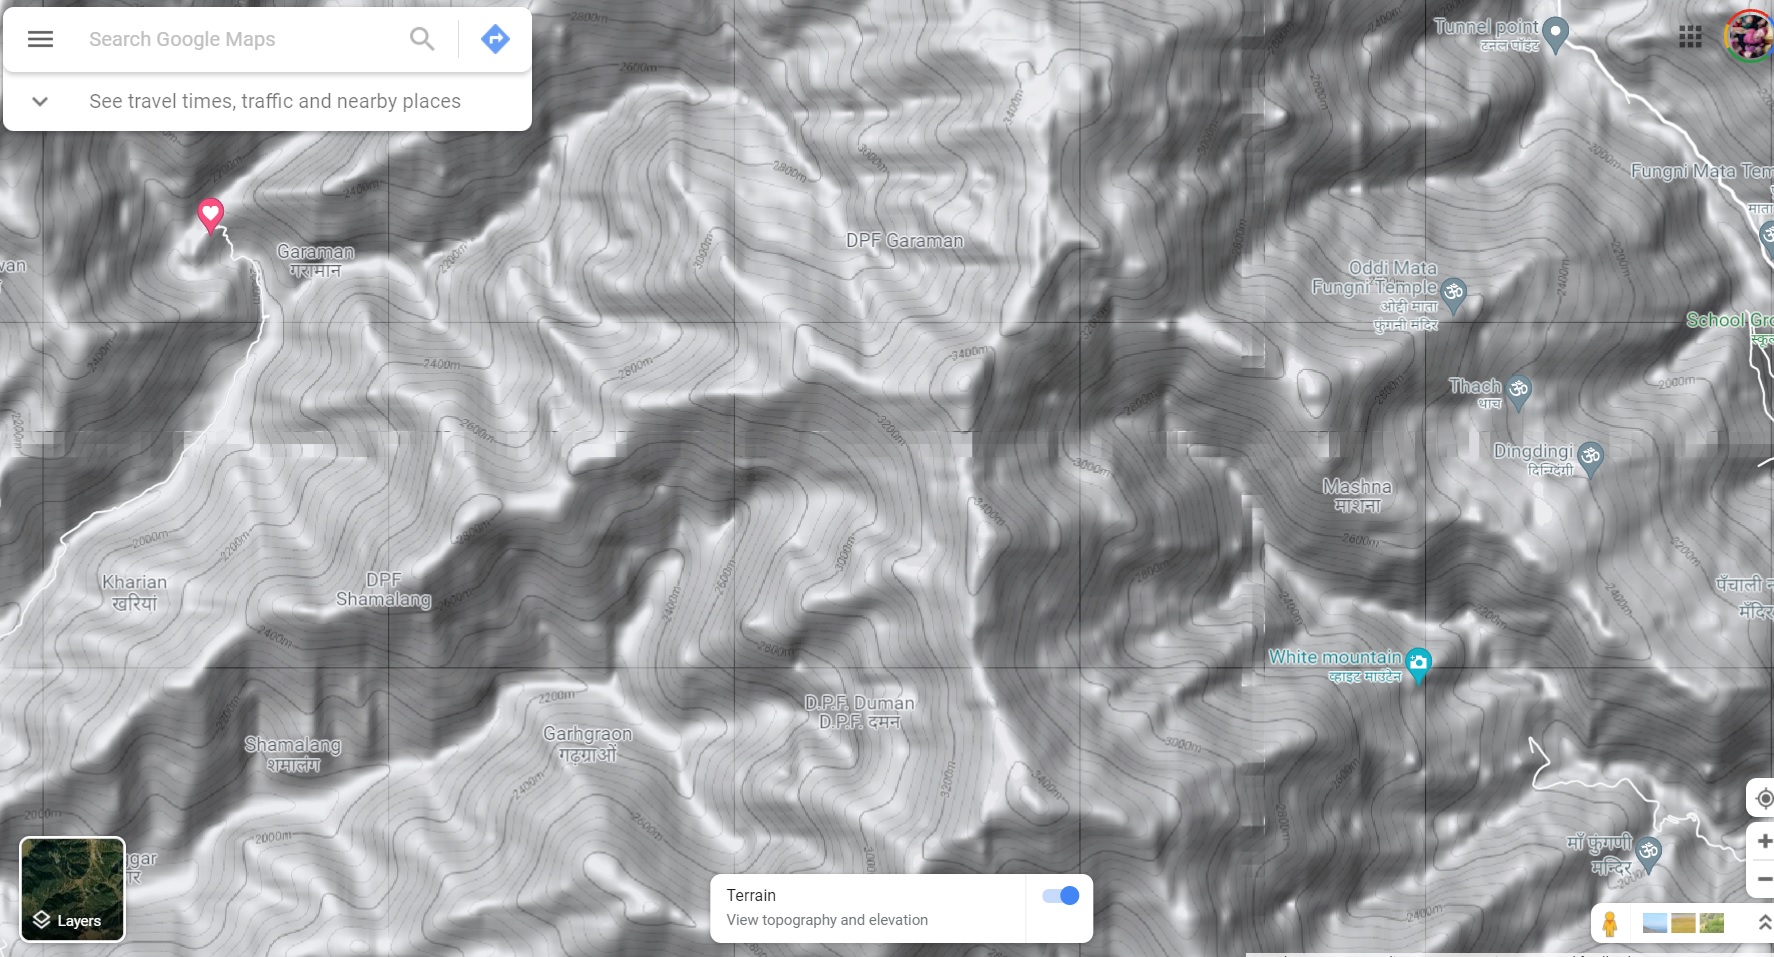
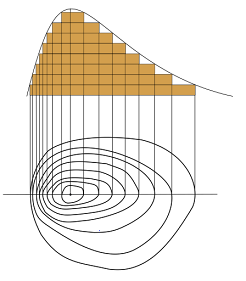
In this second module let’s get familiar with one of the most important concepts: topography. Topographic maps use contour lines to visualize the elevation of the terrain. Elevation is essential for planning your hiking routes. A contour line connects points of equal elevation or altitude. The simple example below shows how a 3D hill is visualized / projected on a 2D topographic map using contour lines. Every inward contour indicates an increase of 10m in altitude. The peak is represented by the innermost contour corresponding to 80m altitude. Contours on the right (East) are more widely spaced indicating a more gradual slope. Contours on the left (West) are closer indicating a steeper gradient. Contours are essential for trail planning in the mountains. Nearly all maps show contour lines to visualize the topography of the landscape.
Terrain Features
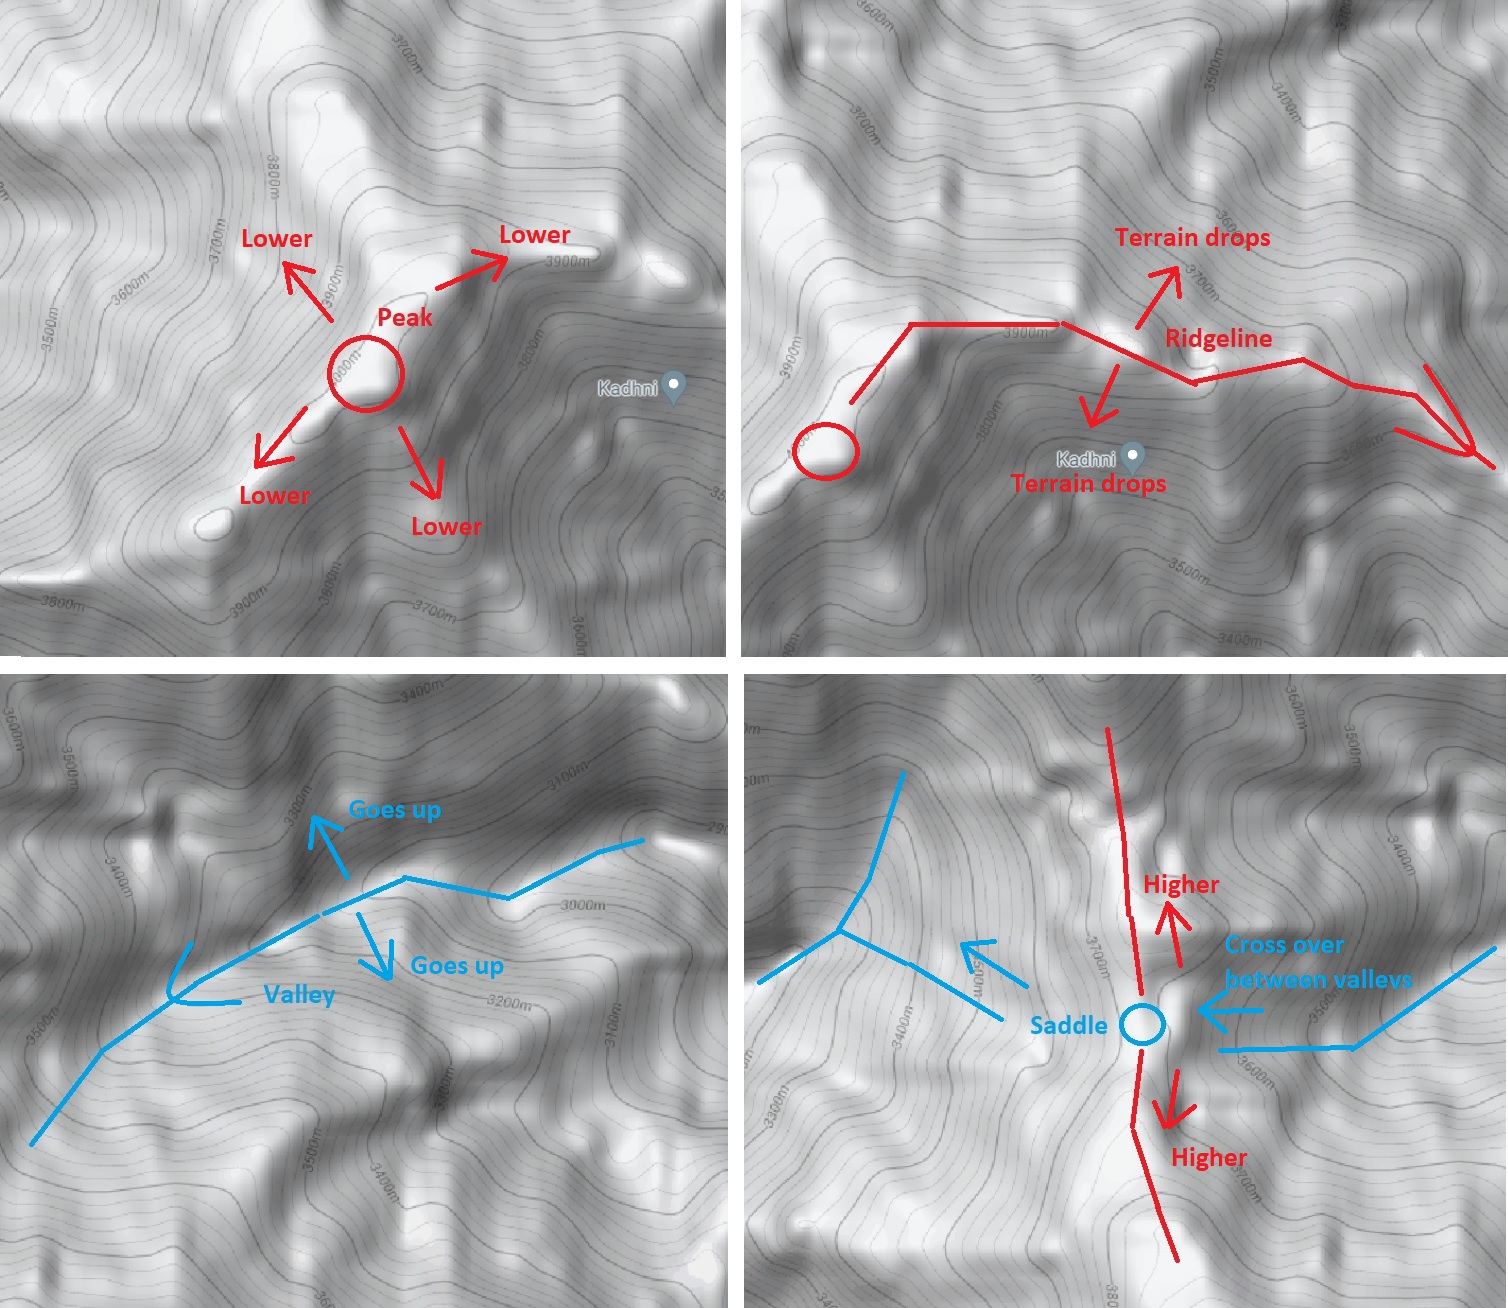
Important terrain features can be easily identified on a contour map: peaks, valleys, ridges, saddles. Peaks are identified as the innermost circles / contours (highest elevation). Starting from peaks, U-shaped contours indicate ridgelines (high lines from where terrain drops down left/right). Inverted U-s correspond to valleys (erosion by water flow curves the landscape / contours inward, terrain goes up if you move left/right on valley slopes). Saddles (some of which are passes) are low points along a ridgeline where hikers usually cross over the ridgeline between opposite valleys. Below illustrations show individual terrain features on a Google terrain (contour) map near the Barot valley:
https://www.google.com/maps/@32.0762522,76.936689,14z/data=!5m1!1e4
(choose Terrain in map layers)
Visualizing Contours
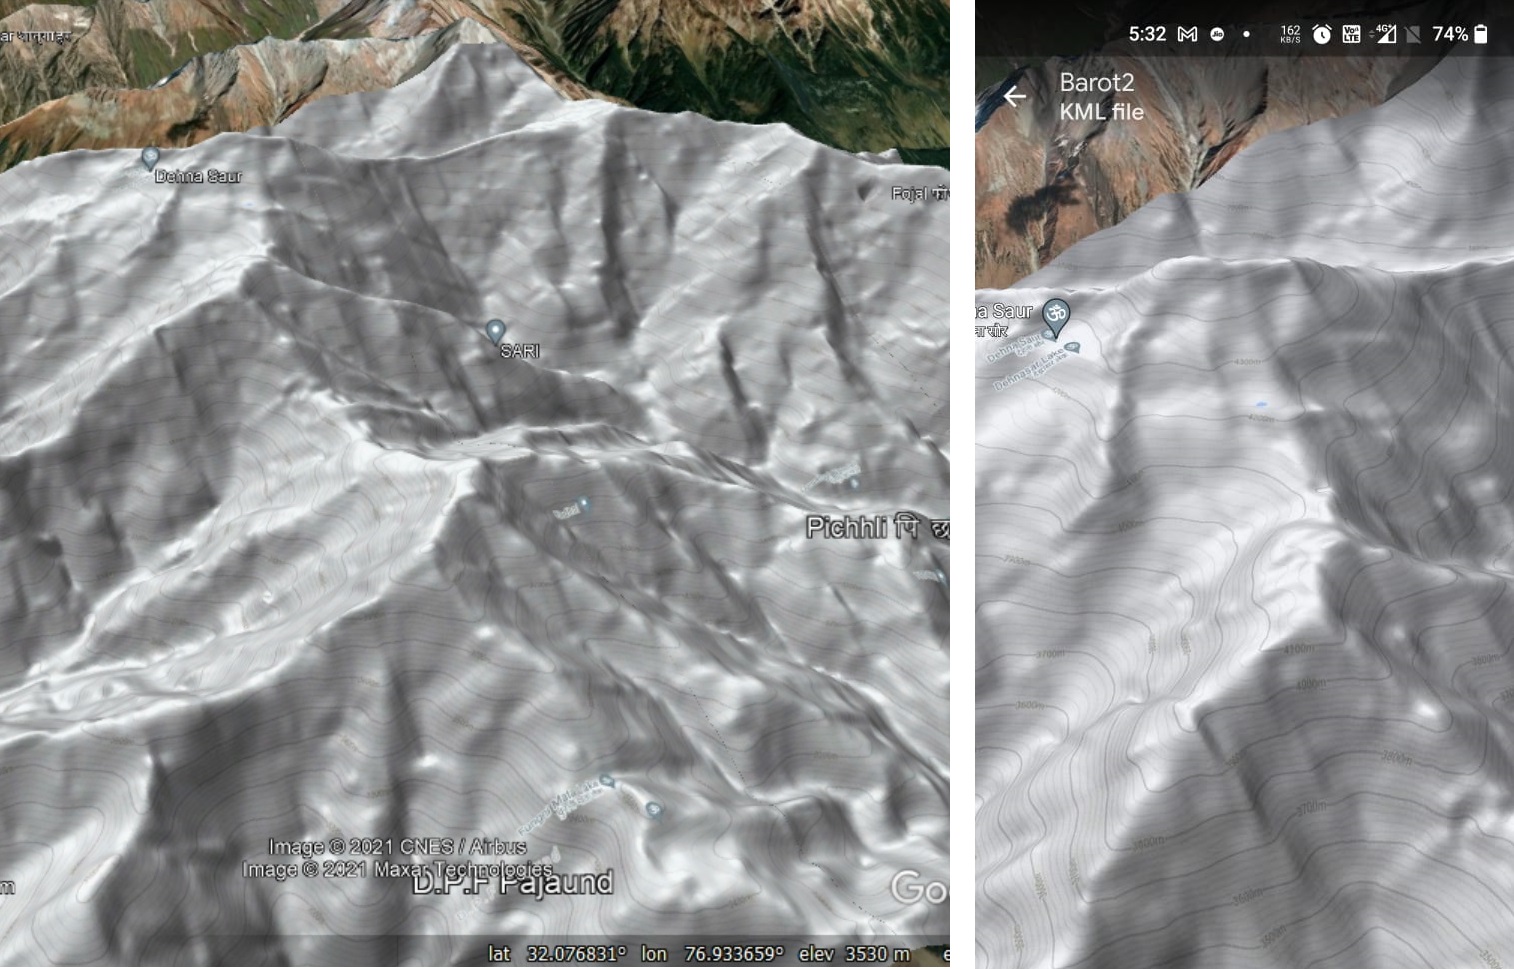
Your ability to visualize contour lines is fundamental to read topographic maps and understand further modules in this bootcamp. Identifying terrain features on maps is critical in planning your hiking routes. To further help your understanding, download this KMZ file (contours around Barot valley) and open it in Google Earth (on mobile or laptop) to visualize contours in a 3D model. Use both your fingers (mobile) or mouse + shift/ctrl (laptop) to zoom / rotate the 3D view and ensure you can clearly visualize the peaks, ridges and valleys through contours in this 3D view:
https://tinyurl.com/barot-contours
A 3D review is somewhat easier to visualize then reading contours after projected on a flat 2D map
Assignment
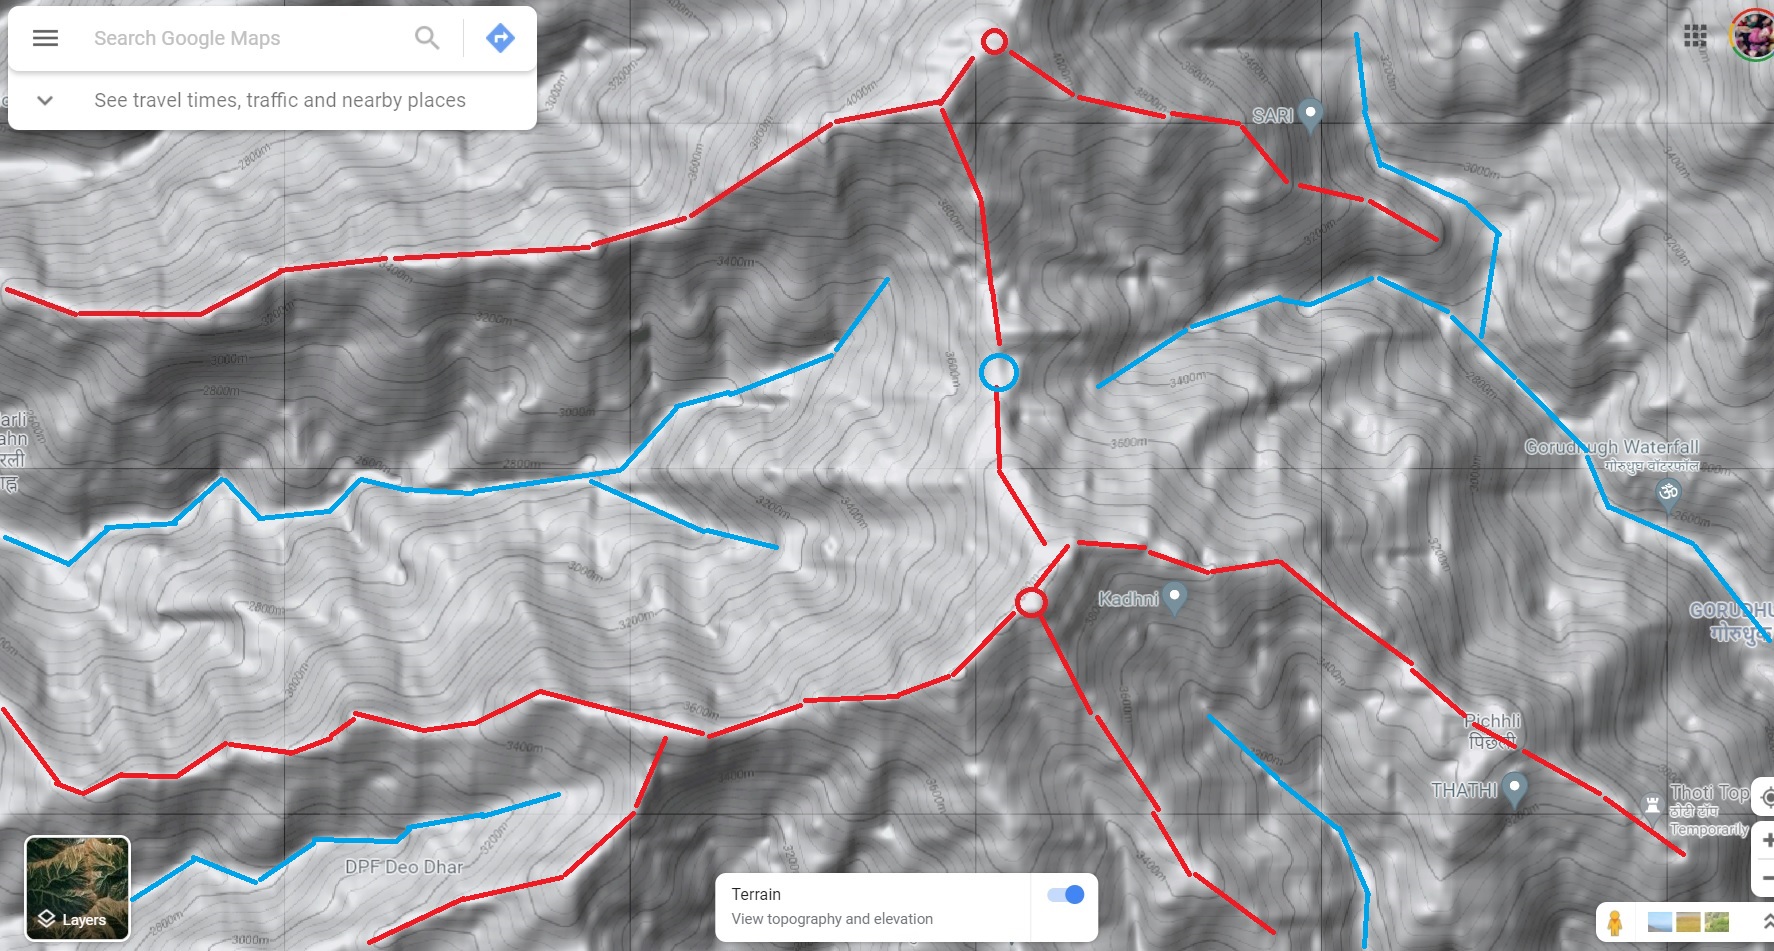
Now it’s time to test your understanding. Open below Google Terrain (contour) map of the lower Barot valley, take a screenshot (mobile or laptop) and mark as many terrain features (peaks, ridges, valleys, saddles) as possible in same color coding as above: (red / blue – lines / circles)
https://www.google.com/maps/@31.9939702,76.966096,14z/data=!5m1!1e4
(choose Terrain in map layers)
Upload your map image in a public folder (Google Photo album, Google Drive, FB album…) and submit the folder link in the form below for review. Make sure folder access is set as public.